You’ve got that one link in bio carrying your shop, your latest drop, or your best video, all in a single click. But do you really know what happens after someone taps it? Are people exploring your links, or dropping off after the first click?
That’s where link in bio analytics comes in. It shows which links get the most love, where your audience is coming from, and when they’re most active. And with tools like Replug, checking it all is as simple as open, tap, scroll.
Let’s break down how to use these insights to get real results.
Maximize marketing ROI
by transforming ordinary URLs into branded short links that convert.
Try Replug for free
What is the best way to track link in bio analytics?
The most effective way to track link in bio analytics is by combining detailed tracking with tools that help you act on what you learn.
Replug makes this simple. It shows how many clicks your link in bio is getting, where your audience is coming from, and when engagement peaks, all in real time. Beyond numbers, it helps you create branded short links that build trust and boost click-through rates.
By adding UTM parameters, you can track the performance of your link in bio, all within Replug’s dashboard. This way, you get a clear view of what’s working and can refine your strategy as you go. Together, these features turn your link in bio from a basic list of links into a powerful, data-driven marketing asset.
Let’s discuss the two easy ways to track your link in bio analytics using Replug.
How to track your link in bio analytics (two easy ways)
First things first: make sure you’re signed into your Replug account.
Haven’t signed up yet? You can start with a 14-day free trial and get full access to your link in bio analytics.
Now, here are two quick ways to see what’s really happening behind your link in bio:
Method 1: Quick check from the bio links tab
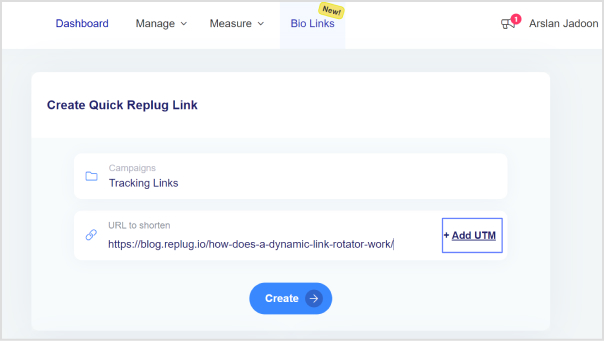
Go to “Bio Links” in your Replug dashboard.
Find the bio link you want to check.
Click the small line chart icon right under it.
This opens up your analytics for that specific bio link, showing:
Views, unique views, clicks, and QR scans
A bar chart comparing views vs. unique views vs. clicks
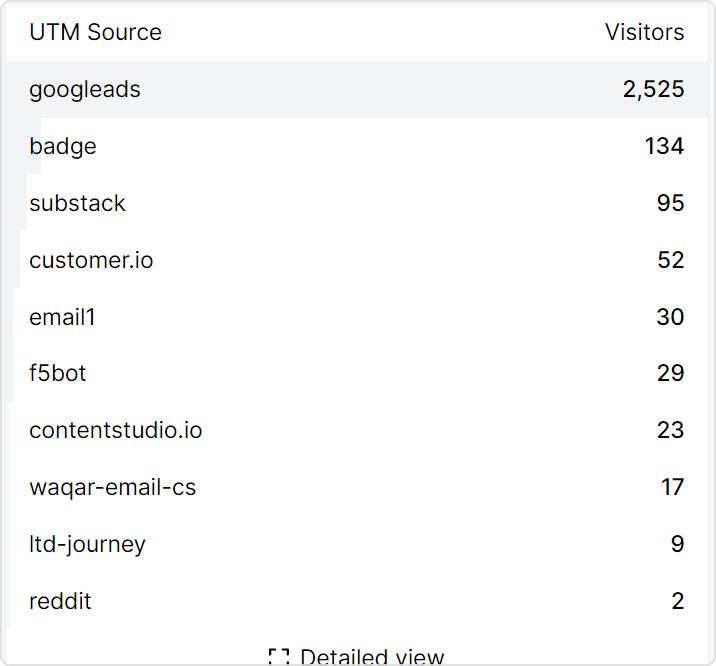
Geotargeting filters so you can see data by referral source, location, browser, and operating system
Real-time stats and custom date ranges (check today, last month, or all time — no limits)
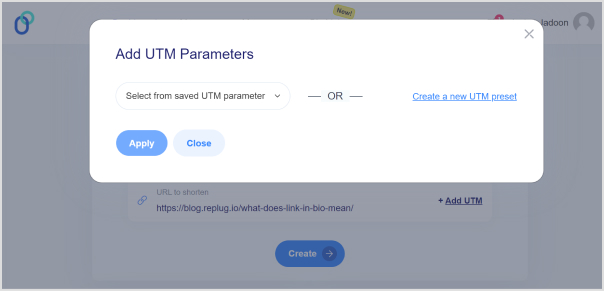
They’re little tags you add to the end of a URL so tools like Replug can track where each click came from.
For example:
Share the same link in a reel and a story
Add utm_medium=reel to one and utm_medium=story to the other
Now you’ll know which actually brings traffic, and which just looks good. Inside Replug, you can create and manage UTM-tagged links easily, so you can track smarter without extra hassle.
Another handy tip: Create a QR code for your bio link
Replug also lets you create a QR code for any of your bio links. So, if you share your link in bio offline on posters, packaging, slides, business cards, or anywhere else; you’re still not flying blind.
Data is great, but action is what makes it matter:
Move your best-performing links higher up
Swap out links that aren’t getting clicks
Post when your audience is most active
Test different headlines, emojis, or thumbnails to see what bumps up clicks
Focus promotion on platforms that actually send traffic
Conclusion
Your bio link shouldn’t just look pretty. It should work. Clicks, sign-ups, sales, traffic – whatever your real goal is.
And the good news? It’s simpler than you think.
With Replug’s link in bio analytics, you can see what’s working, what’s getting ignored, and where your audience is coming from, all in a few clicks.
Add UTM parameters to track which posts drive traffic, and use QR codes to bring in offline scans too. Then adjust: move your best links up, drop the ones that flop, and post when your audience is most active.
Your link in bio is more than a link. It’s your quiet traffic driver and digital storefront.
Now you know how to use link in bio analytics to make it deliver.
FAQs on link in bio analytics
What are links in bio?
A link in bio is the clickable URL on your Instagram, TikTok, or other profiles. Since most platforms allow only one, tools like Replug let you turn it into a mini landing page with multiple links to your shop, videos, or content.
What is a tracking link?
A tracking (or trackable) link has extra tags, like UTM codes, that show where your clicks come from and what drives traffic. Tools like Replug can create these automatically.
How to track link in bio analytics on Instagram?
In Replug’s analytics dashboard, you can see referral sources, so you’ll know how much traffic is coming from Instagram.
How to track link in bio analytics on TikTok?
In Replug’s analytics dashboard, you can check referral sources to see how many visitors came from TikTok.
Tracking performance is key to improving any marketing effort. Whether you’re running a one-time promotion or managing multiple campaigns across different platforms, understanding what’s working (and what’s not) helps you make better decisions.
This guide walks you through how to measure campaign performance in Replug, step by step, so you can gain clear insights, optimize your strategy, and get more out of every click.
A complete link management solution
for marketing professionals & agencies.
Try Replug for free
What is campaign analytics?
Campaign analytics is the process of tracking and analyzing data from marketing campaigns to measure performance and refine strategies. It helps marketers understand which channels drive conversions, how users interact with content, and where to focus efforts for maximum impact.
In link management, campaign analytics is essential. It tracks clicks, conversions, and audience behavior for each link, helping you optimize performance and improve ROI. To get started with campaign analytics in Replug, follow these simple steps:
How to measure campaign performance in Replug?
Step 1: Log in to your Replug account
Go to Replug and sign in with your credentials. If you don’t have an account, you’ll get a free 14-day trial upon signing up.
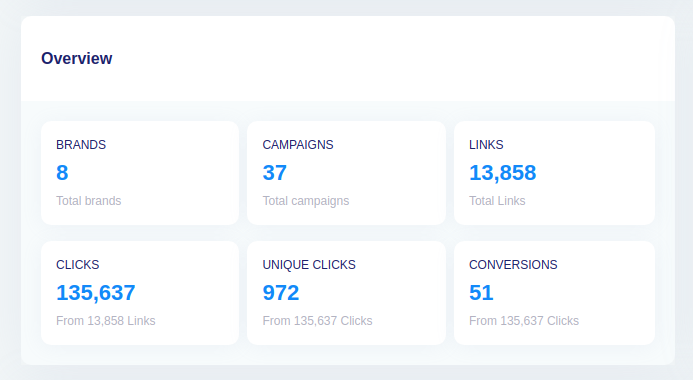
Step 2: Click on “Campaigns”
Once logged in, click on “Campaigns” from the navigation to view all your active and archived campaigns.
Step 3: Click on “View stats”
Find the campaign you want to analyze and click the “View stats” button.
Optional: You can filter campaigns by:
Date range (e.g., last 7 days, last 30 days, custom range)
Hide/Show columns (CTA type, campaign type, headline, total links, total clicks, unique clicks, QR scans)
Campaign status (active, archived)
Step 4: Track campaign performance
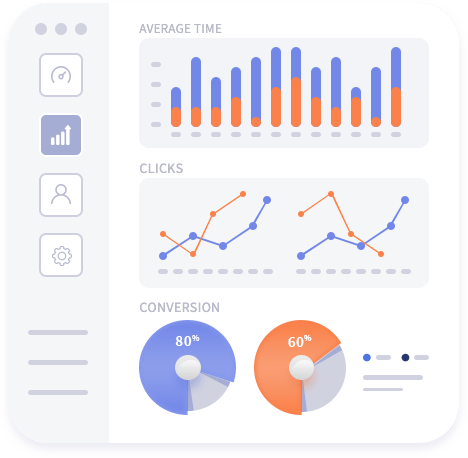
Inside the stats dashboard, Replug gives you a complete view of your campaign’s activity:
Step 5: Apply campaign filters for deeper insights
To fine-tune your analysis, Replug lets you filter your data by:
Time period: Choose from preset ranges or set a custom date range.
Link type: The comparison graph will adjust based on the type of campaign selected: • Short links: Clicks vs Unique Clicks vs QR Scans • Bio links: Views vs Unique Views vs Clicks • QR codes: QR Scans vs Total Clicks
This helps you compare different formats and gain insights into how each type performs.
Benefits of analyzing campaigns with Replug
Here’s how campaign analytics with Replug can elevate your marketing efforts:
Easy visual comparison: The real-time graph shows how your campaign is performing over time, helping you quickly spot spikes, dips, and trends.
Optimize campaign performance: Identify your best-performing content, platforms, and formats, so you can focus on what brings the highest ROI.
Tweak strategies in real time: See what’s working while your campaign is live and make adjustments on the go to improve results.
Smarter marketing decisions: Insights by location, device, browser, and referral source help you shape future campaigns more strategically.
Better reporting and client updates: Export clear, presentation-ready data to share progress with clients or internal teams.
Improved retargeting and remarketing: Use behavior data to segment your audience and retarget them more effectively.
💡 Want to go a step further?Replug’s retargeting pixels let you re-engage people who click your links across ad platforms.
Content and platform testing: Use data to A/B test formats and messaging across different channels and learn where your audience is most responsive.
Cross-campaign insights: Compare short links vs. bio links vs. QR codes to see which formats bring the most traction.
Maximize marketing ROI
by transforming ordinary URLs into branded short links that convert.
Try Replug for free
Understand audience preferences: Get to know your users better, what they use, where they’re from, how they click, and tailor your marketing accordingly.
Conclusion
Replug gives you more than just link shortening; it gives you clarity. With its detailed analytics dashboard, campaign filtering, and real-time metrics, you can dig deep into performance, uncover valuable insights, and improve your marketing strategy with confidence.
Whether you’re running a single link campaign or managing dozens, Replug makes measuring success simple and actionable.
FAQs on how to measure campaign performance
Can I export performance reports from Replug?
Yes, Replug lets you export data for use in reports, presentations, or internal updates.
Does Replug show stats in real time?
Absolutely. Replug updates metrics live, so you always have the latest performance data.
Can I track QR code performance?
Yes. QR scans are tracked alongside link clicks and displayed in the campaign dashboard.
Will I still see stats for archived campaigns?
Yes. Just filter by “archived” campaigns and you’ll be able to view their full performance history.
Pinterest is a top-tier social media platform that stands right next to all major players, such as LinkedIn, X, Instagram, Facebook, and TikTok. It has over 522 million monthly active users.
Wether you have you have your own store on Pinterest or into Pinterest affiliate marketing. You should know that its no ordinary social media platform; it’s a very niche-oriented platform. Certain niches perform very well including but not limited to lifestyle, fashion, gardening, and pets.
It’s believed that Pinterest is more of a female-dominating social media platform, and rightly so. According to a 2024 Statista report, over 69.4% of Pinterest users were females.
Speaking of analytics, Pinterest has an effective, easy-to-browse analytics section that lets users navigate through their Pinterest statistics.
Let’s crack this open and try to comprehend how to utilize Pinterest analytics for the better.
What is Pinterest analytics?
Pinterest analytics is the statistics section of the Pinterest dashboard, where users can monitor, track, and analyze the performance of their Pinterest content.
Pinterest analytics section reports how the content is performing. It comes in handy when a user can keep track of the Pinterest pins, for instance:
How many impressions did the pins get?
How many clicks did the pins receive?
Which pins are getting more impressions and clicks?
How many visitors is Pinterest sending to your website?
Putting out a lot of Pinterest content consistently is the way to go, but publishing content without a clear strategy won’t make a difference.
Suppose, you’re publishing 15 pins on Pinterest per week but not keeping track of which ones are getting impressions, unique clicks, and better CTR, then you might not see exponential growth. The reason is that you won’t have any idea what’s working on your Pinterest account.
So, pay close attention to your Pinterest analytics section and monitor key metrics.
Boost ROI with branded URLs!
Enhance your marketing campaigns by creating shareable, trackable, and fully multi-purpose
customizable branded URLs.
Social media success doesn’t happen on a whim. There is always a strategy and mindset behind the growth. It’s essential to decipher what it takes to grow on Pinterest, and understanding why Pinterest analytics matter is a good start.
Pinterest analytics are important for many reasons, but take a look at the five most important ones:
1. Keeping an eye on the key performance metrics
It allows you to understand what content resonates with your audience. By tracking pin metrics, such as impressions, saves, clicks, and overall engagement, a user can see which pins are performing well and which ones are not.
2. Effectively driving your Pinterest content strategy
Pinterest analytics provides insights into the best times to post, the types of images and descriptions that drive engagement, and how the content is based on the top trends that yield benefits. Moreover, it helps Pinterest users refine their content and strategy to cater to their audience according to their expectations and needs.
3. Monitoring your Pinterest ROI
Monitoring your Pinterest ROI is crucial for understanding the value that Pinterest brings to your businesses, agencies, and influencers. A data-driven approach ensures that your Pinterest content strategy is not based on guesswork but on actual content performance data, leading to more impactful and successful campaigns.
4. Getting deeper into the audience insights
Looking into audience insights provides a more comprehensive understanding of who your followers are, what they are interested in, and how they interact with your content.
Pinterest analytics offers demographic information about users’ interests and the behaviors of their audience by enabling users to create more personalized and relevant content. A deep dive into such insights helps in making informed decisions about the campaign.
5. Exporting Pinterest analytics reports
The story continues after accessing the analytics through the Pinterest dashboard. Users can download their Pinterest analytics reports in XLS format. Sharing insights with your team or stakeholders is a must.
These reports offer a clear visual representation of your company’s performance metrics, global trends, and audience insights. Regularly exporting and reviewing these reports ensures that everyone involved is on the same page and can contribute to refining and enhancing your overall strategy.
3 Best tool to check Pinterest analytics
There are several analytics tools available on the market, but here are three tools everyone should know about:
1. ContentStudio
ContentStudio is a top-tier social media management tool that enables marketers, brands, and influencers to efficiently schedule, publish, manage, and track their social media and blog content across various platforms. Trusted by over 70,000 users globally, it stands out as one of the best social media schedulers available.
With ContentStudio, you can seamlessly build your Pinterest strategy by visually planning and scheduling your Pins to drive meaningful engagement—all from a single platform. Here’s what ContentStudio offers for Pinterest scheduler:
Pinterest analytics: Identify which pins drive the most clicks, views, and impressions to refine your strategy.
Followers trend graph: Track your follower growth over time with an easy-to-read graph.
Presentation-ready reports: Access insightful reports or customize your own to highlight key metrics for growth.
Multiple publishing options: Choose to publish instantly, schedule for later, or add to a queue, all with flexible options.
Content categories: Organize and schedule your content by categories like fashion, DIY, or recipes.
Seamless approval workflows: Quickly get content approvals to ensure everything aligns with your goals.
Pinterest video thumbnail: Easily manage and optimize your Pinterest content with a visual content calendar.
Pricing:
Starter plan – $25 per month
Pro plan – $49 per month
Agency plan – $99 per month
2. Replug
Replug is an advanced URL management tool for brands, marketers, and agencies. It provides a full suite of features for creating, managing, and analyzing short URLs, making it an essential asset for effective digital marketing.
Additionally, with Replug, you can track the performance of your Pins with precision. This helps you monitor clicks, conversions, and engagement metrics, enabling you to refine your Pinterest strategy and achieve better results. Here’s what else you can do to optimize your Pinterest board:
Utilize UTM parameters:Add UTM parameters to your Pin links to track the performance of specific campaigns and identify the sources of traffic and conversions.
Track clicks and conversions: Monitor the number of clicks your Pins generate and track conversions, providing a clear view of how effectively your Pins drive traffic to your site.
Retargeting campaigns: Implement retargeting strategies to re-engage users who have interacted with your Pins, encouraging them to revisit and take action.
Pinterest bio-links: Shorten and customize your bio-links for better tracking and more efficient redirection to your landing pages.
Shorten your pin links: Use Replug to create shortened, branded URLs for your Pins, making them more user-friendly and easier to track.
A complete link management solution
for marketing professionals & agencies.
Try Replug for free
Pricing:
Basic plan – $19 per month
Professional plan – $49 per month
Agency plan – $79 per month
3. Pinterest Analytics
Pinterest’s comprehensive analytics tool delivers in-depth insights into your content performance, engagement metrics, clickability, and audience demographics. This valuable resource is available to all Business Pinterest accounts and is essential for optimizing your Pinterest strategy.
Pinterest analytics isn’t just about taking a glance at the Pinterest content insights and leaving this Pinterest dashboard area for weeks. Instead, the Pinterest user must know what they’re looking for or what they’re trying to improve on the platform.
Therefore, it’s vital to know the important Pinterest metrics to know for tracking. Here’s the list of Pinterest metrics to track no matter what niche you’re in:
Impressions
It’s the total number of times the pins are seen on the screen. The user may not necessarily click the pin and keep scrolling through the timeline. If your Pinterest pin happens to be there, you get an impression.
Engagements
Engagements are the total number of times users interacted with your Pinterest pins – this includes both clicks and saves. Simply put, it’s the total number of clicks on your pins by the users.
Pin clicks
A pin click on Pinterest refers to the click or tap on the pin that opens the pin image in closeup.
Top pins
Top pins are top-performing content on Pinterest in the given period.
Profile visits
Profile visit is an essential Pinterest metric that showcases how many visitors landed on your profile after discovering your pins on and off the platform.
Follows
Follows mean the total number of Pinterest users who followed your Pinterest profile after interacting or discovering your Pinterest content. The more attention an account gets, the quicker the number of followers grows.
Total audience
It refers to the total number of Pinterest users who come across your pins or see your content on Pinterest. This Pinterest metric gives you some idea of how well your content is being discovered by new users.
Outbound clicks
Outbound clicks are the total number of times users click on the destination URL added to the Pinterest pin. A lot of users use Pinterest to drive traffic to their blogs, so that is called outbound clicks.
Saves
Saves is a Pinterest metric that represents the total number of times users saved your Pinterest pins. So, this is how it works: if users like your pin and want to add this pin to their Pinterest board, they’d simply save the pin on their board.
Engaged audience
It’s a metric that showcases how many pinners engaged with your Pinterest pins. This metric excludes users who have only seen your pins but never interacted with them.
Engagement rate is a metric that explains the percentage of engaged users compared to the total users who came across your content. For instance, if 10 out of 100 users interact with your pins through comments, likes, or saves, then the engagement rate is 10%.
Pin click rate
Pin click rate is the percentage that describes the total number of clicks on the pins as compared to the pins viewed by the audience. To get the pin click rate, simply divide the total pin clicks by the total number of pins seen by the audience.
Save rate
Save rate describes the total number of saves divided by the total number of save options appearing on the screen.
Monthly total audience
The monthly total audience refers to the total number of users either seen or engaged with your pins on Pinterest in the last 30 days. It’s pretty much the same as the total audience but calculated for the last 30 days.
Monthly total engaged audience
It’s the total number of Pinterest users engaged with your Pinterest pins through saves, comments, and likes in the last 30 days.
Followers’ demographics
One of the Pinterest metrics to look out for is the followers’ demographics which explain the age, gender, location, and device of the audience. It’s available in the audience insights section of Pinterest Analytics.
Here’s the step-by-step process of accessing Pinterest analytics on the desktop:
Step #1: Log in to your Pinterest account
Log in to your Pinterest account on a desktop PC. However, make sure that you have converted your account into a business account.
If you haven’t switched to the business account, you won’t be able to access the Analytics. Therefore, switch your Pinterest account type before accessing Pinterest analytics.
It’s safe to say that give Pinterest at least two to three weeks (after you switch to a business account) before you start analyzing the Pinterest pins.
Step #2: Open the Business Hub
We’re assuming that you have switched to a business account at least three to four weeks earlier, so you’re good to go.
Once logged in to your Pinterest account using your username and password, now click on the “Business Hub” hamburger menu bar on the top left of the screen.
A pop-up menu window would appear. This is where you can access Analytics and other options.
Step #3: Access the Analytics section
Go to the Analytics section and choose Analytics Overview first.
This is the dashboard section where you can see the Pinterest analytics.
Go through different metrics and see which pins are performing well.
You can further hop on the Audience Insights section and get to know more about your Pinterest audience.
Go beyond generic link pages!
Create custom bio links that truly fit your brand
With Replug, you can create bio links that are unique, engaging, and built to convert.
Accessing Pinterest analytics on mobile comes in handy when you’re on the go or going to travel for a while. Therefore, a Pinterest mobile app can save the day.
Some travel bloggers, affiliate marketers, and influencers heavily rely on Pinterest for their social media attention and blog traffic, so they can’t afford to miss out on their social media analytics.
Here’s how to access Pinterest analytics on the mobile device:
Step #1: Sign up for a Pinterest account
Sign up for a Pinterest account if you haven’t already. If you already have a personal account, switch to a business account or create a new one for your brand.
It’ll take a minute or so. Once you’re done with the Pinterest account setup, move on to step two.
Step #2: Publish or schedule some pins
To see the Pinterest analytics section and how it works, you must have some numbers popping up on the platform. It’ll only be possible when you have published some pins in the last three to four weeks.
However, you can still access the Pinterest analytics on your mobile device even if you haven’t published a single Pinterest pin yet. The only difference is that there won’t be any analytical metrics to see. It’s your choice, anyway!
Step #3: Download the Pinterest mobile app
It’s time to download the Pinterest mobile app on your phone. Pinterest apps are available on both Android and iOS.
Since we’re assuming you have already created your Pinterest business account, it’s time to get the Pinterest mobile app and get started with it.
If you don’t own a desktop PC, you can start the whole Pinterest analytics on mobile thing from here too. Just download the Pinterest app and create your Pinterest account. Switch over to the Business account.
You’re all set.
Step #4: Go to the Pinterest profile
To get started with your Pinterest account on the mobile, log in to your Pinterest account to access the analytics.
Once logged in to your account, go to the profile section of the profile.
All you have to do is tap on your display picture at the bottom right.
Step #5: Access the analytics section
After landing on your profile, you’ll see the Pinterest analytics icon on the top left of the profile.
Tap on the analytics section icon, and the analytics section will appear.
That’s how you can access Pinterest analytics on a mobile device.
Pinterest analytics are vital to driving your Pinterest content strategy in the right direction. The analytics section gives you a deep dive into Pinterest content statistics, telling you which pins outperform others.
Pinterest users can always take the patterns, subject matter, graphics design concepts, and other details of their winning pins and apply those tactics to their pins. This will help them replicate the same success in the future.
The purpose of writing a piece about Pinterest analytics is that analyzing Pinterest analytics helps you steer your Pinterest marketing strategy toward success.
FAQs about Pinterest analytics
Here are the commonly asked questions about Pinterest analytics;
How can I see my Pinterest analytics?
Start by converting your personal Pinterest account into a business account, and then go to the Business Hub and access the Analytics section to see your Pinterest analytics. Moreover, you can also track your Pinterest analytics through third-party social media analytics tools like ContentStudio or Usermaven.
Is Pinterest analytics free?
The Pinterest analytics tool is free. To use it, you need to convert your personal account into a business account. Voila!
Does Pinterest rank on Google?
Pinterest is a search engine-friendly social media platform. This means Pinterest pins can easily be indexed and ranked on Google.
How do I analyze Pinterest trends?
You must access the Pinterest trends section and type in your keyword to see the trends around your topic. Moreover, you can explore the trending topics highlighted by Pinterest.
How to be successful at Pinterest?
Create engaging, helpful, and attractive pins using a relevant content strategy for Pinterest. If you create attractive and helpful content for the right audience, no one can stop you from growing on Pinterest.
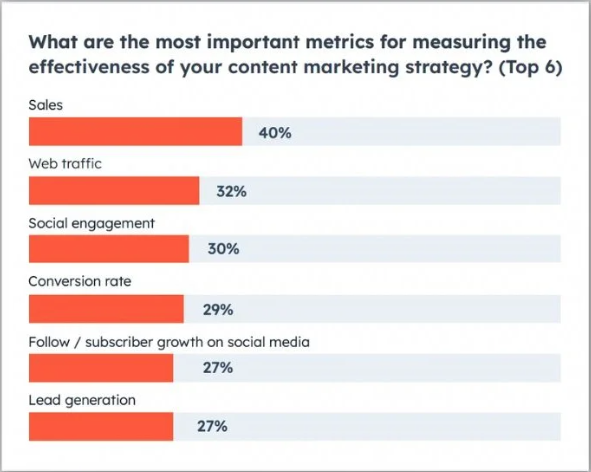
Marketers, bloggers, and SEOs strive to get the readers’ attention through different means. 50% of the marketers consider lead generation a top priority when running marketing campaigns.
One of the key indicators of readers’ interest in the content is lead generation.
This can be seen through actions such as clicks on CTAs, downloads of opt-in incentives, or sign-ups for a free trial.
However, the challenge that occurs is how to track those leads.
Without leads tracking, it’s impossible to determine where these leads are coming from or what’s working best for the campaign.
In fact, 61% of marketers consider generating traffic and leads to be their biggest challenge.
Let’s explore the idea of lead tracking and try to comprehend the processes behind tracking leads effectively.
What is lead tracking?
Lead tracking is a process of monitoring the stage of the leads during their conversion journey, understanding where they are in the funnel, and ensuring a smooth transition for the conversion.
Most prospects don’t convert right away; they take some time before they press the buy button.
Therefore, companies come up with a system to follow up with potential customers regularly until the deal is closed.
Simply put, it’s about understanding the behavior of potential customers and keeping an organized record of their engagements, requests, and actions.
A complete link management solution
for marketing professionals & agencies.
Try Replug for free
Why is it important to track leads?
A well-designed leads tracking mechanism helps marketers and brands analyze the effectiveness of their lead generation funnel.
Sometimes, a potential customer is willing to buy the product but can’t figure out something tiny – it could hinder the transactional part of the purchase. The lead tracking system can identify where the prospect is stuck and fix what’s stopping the potential customer from converting.
Therefore, lead tracking activity can provide a sense of understanding to the seller what these potential customers might want to know or what might be the appropriate action to take right now.
To truly understand the importance of tracking marketing leads, it’s vital to go through its benefits to comprehend the effectiveness of this course fully:
1. Improved conversion rates
The first and foremost benefit of tracking leads is the improved conversion rate. By monitoring prospects or lead behaviors, marketers can identify which strategies and touchpoints are most effective in converting leads to customers.
Such an action assists marketers in understanding the situation, allowing optimization of sales efforts and improving the conversion funnel.
Lead tracking helps brands come up with valuable data that allows brands to predict future sales trends with more precision.
Tracking leads assists sellers in understanding the journey of leads through the sales funnel and provides an opportunity for businesses to make informed decisions on resource allocation and strategy adjustments.
3. Customer insights
Marketers are keen to know where the potential customers stand after inquiring about the product clicking on the ad or filling up the sign-up form. Lead tracking provides a whole heap of useful data about potential customers’ preferences, behaviors, and pain points.
These insights can help brands and marketers create tailor-made offers to meet the customers’ expectations and eliminate the ambiguities in the customers’ minds.
4. Streamline sales system
One of the benefits of lead tracking is that it helps businesses identify and eliminate bottlenecks and streamline sales processes, ensuring a smoother journey from lead to customer.
Once the sales process is streamlined, the sales cycle is faster and more efficient.
5. Data-driven targeting
Lead tracking revitalizes lead conversion by implementing effective engagement techniques. A significant advantage of tracking such campaigns is that it enables marketers to segment leads based on demographics, behavior, and their stage in the buyer’s journey. This segmentation allows for the creation of more personalized and targeted marketing campaigns, leading to improved results.
Campaign tracking, therefore, is essential for brands and marketers to optimize their lead generation funnel and enhance overall lead conversion. These are just some of the many benefits of lead tracking that marketers should leverage to drive better outcomes.
How does lead tracking work?
Lead tracking is an integral tool in digital marketing that helps companies gather the necessary information to close deals and boost revenue. It involves identifying the sources and locations of potential customers and taking every step necessary.
A crucial aspect of lead tracking is data collection, where marketers gather useful information on the leads. The data enables digital marketers and conversion experts to improve their campaigns, customize offers, expand their customer base, and eventually drive more sales.
One of the significant advantages of lead tracking is the ability to provide a detailed picture of marketing campaign outcomes. According to Neil Patel, 76% of marketers struggle to estimate campaign ROI.
More importantly, lead tracking allows marketers to go deep into the sales and marketing insights and capture useful information that otherwise would have been kept in the box. Businesses and marketers can use this crucial information to increase marketing campaigns and organizational efficiency.
It’s safe to say that by implementing an efficient lead-tracking system, businesses can improve customer retention, evaluate the effectiveness of their marketing tactics, and optimize their customer acquisition process.
5 Steps of lead tracking process
Take a look at the essential steps involved in tracking leads:
Plan the campaign: First things first, map out the plan of the lead tracking process. Determine what you want to achieve and why it’s important for success.
Identify a “good” lead: Before diving deep into the process, be clear on the concept of a good lead. Every lead is different, so try to optimize the process to generate high-quality leads.
Pick a lead-tracking software: Opt for an affordable, easy-to-use CRM tool that offers lead-tracking service. There are several types of lead tracking softwares that differently, but the idea is the same.
Capture and nurture leads: Once the lead generation process starts to capture leads, build strategies to nurture leads. Don’t bombard your leads with offers to convert – give them some time. Free courses, tutorials, and workshops often help push the leads convert into customers.
Track leads conversion: Finally, step up to track leads conversion using the lead tracking tool. Conversion tracking would give you an inside-out report on the effectiveness of the lead tracking process.
6 Elements of lead tracking
Here are the essential lead-tracking elements that one should be tracking:
Name: The names of the leads help marketers or brands identify, communicate, and sort them through if needed. Without a unique name, it might not be possible to manage and organize the leads.
Company name: The company name is the workplace where this person works. Stating the company name ensures that the marketer or brand can find out about the employment status.
Job role: A job role tells about the designation and the job description of the lead. It’ll be useful to know what role this person plays at a company.
Phone number: The phone number ensures that the marketer or brand can reach out to this person via telephone.
Email address: The email addresses of the leads help marketers send out necessary emails, such as discount offers, follow-up emails, and order confirmations.
Postal address: A postal address is mandatory if the business is selling a physical address. Without a postal or mailing address, the brand might not be able to mail stuff.
So, this is the list of data items to track when setting up a lead-tracking campaign.
6 Best ways to track leads
Let’s take a look at some of the best ways to track leads:
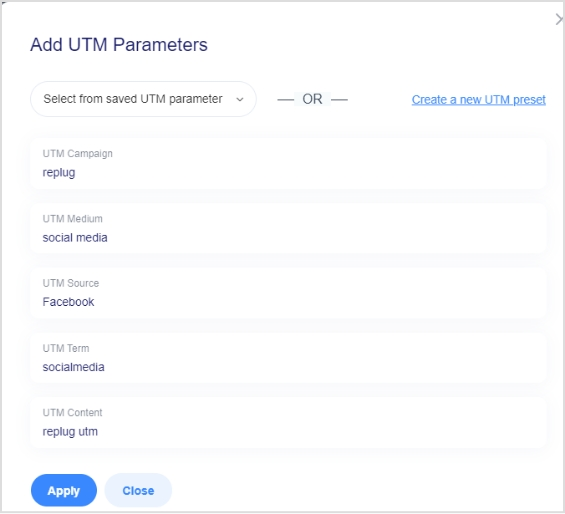
1. Capitalize on UTM parameters
UTM parameters are a great way to track and analyze link performance based on different engagement metrics. It’s a set of codes that appear next to the URL slug. These parameters are extremely efficient in tracking clicks, conversion, and CTR.
By incorporating UTM parameters in your URLs, you can identify which marketing campaigns are driving the most traffic and conversions. Thus, detailed tracking allows for precise adjustments in strategy, enhancing overall marketing effectiveness.
The following are the best tools to add UTM parameters to a link:
Replug allows you to effortlessly create UTM parameters for your links, enabling detailed tracking of your marketing campaigns. The good part is that the tool offers both Free and paid version. The advance version allows you to monitor clicks, conversions, and other key metrics to optimize your strategy.
Usermaven’s free UTM builder is another powerful tool that helps you generate UTM parameters quickly and efficiently.
2. Use a powerful CRM tool
A CRM tool refers to a customer relationship management tool – it’s a dashboard that administers the engagement, collaboration, and communication between a company and the customer. Using an efficient and reliable CRM tool can come in handy in tracking leads.
Moreover, a robust CRM system, with the expertise of Dynamics CRM consultants, not only tracks interactions but also integrates with other tools and platforms, offering a broader experience of all customer activities.This integration aids in identifying potential leads and nurturing them through personalized communication and targeted marketing efforts.
Try the following CRM tools to help start customer engagement:
Digital analytics tools are crucial to keeping track of business performance. It’s vital for a business to keep track of every bit of detail about its prospects and customers. An analytics tool assists with monitoring and tracking different engagement and conversion metrics. It sure is one of the best ways to track leads.
Analytics tools offer insights into user behavior, helping businesses understand what works and what doesn’t. By digging deeper into the data, such as page views, session duration, and bounce rates, companies can refine their strategies to improve lead generation and conversion rates.
These are two of the best analytics tools on the market:
Promo codes are given to the customers by merchants to avail of a special discount offer – usually, such discount offers are for a limited period. It turns out, promo codes can also track leads and conversion.
All merchants have to do is track the specific promo code and fetch all the transactions that happened using the promo code. As a result, businesses can determine the effectiveness of their marketing campaigns.
This tracking method also helps in identifying which customer segments are most responsive to promotional offers, enabling opportunities for more accurate and targeted campaigns in the future.
Here are two promo code tools to try out:
Coupon X
Reveal Button
5. Follow-up in person
Follow-up in person is a common way to track leads. Marketers and sales representatives often follow up with prospects who inquire about the product or use the trial version.
A sales representative can reach out to the prospect and inquire about the plan for converting into a paid customer.
In-person follow-ups create a more direct and meaningful connection with potential customers. Not only does it help in gathering feedback but also in addressing any concerns or objections the prospect might have, increasing the likelihood of conversion.
Here are two ways to track leads in person:
Email
Text message
6. Setup custom CTAs & shortened links
Leads tracking has never been this fun and exciting. Now marketers and bloggers can create short URLs or custom call-to-actions and track leads.
Replug is our go-to link management tool that does it all. All you need is to sign up for an account and try it for yourself. To track leads, one must know how to create the specific campaign accordingly.
Replug allows users to track leads using CTAs and short URLs. Let’s learn how you can do this:
Boost your conversion rates with irresistable CTAs with
Lead tracking comes in different shapes and forms.
One of the ways to track leads is by using custom call-to-action.
Let’s find out how users can create custom CTAs and track leads using a powerful URL-tracking tool called Replug:
Step #1: Sign up for a Replug account
Start with signing up for a Replug account – it has a 14-day free trial with no strings attached.
After the successful sign-up, log in to your Replug account using your login credentials.
The Replug dashboard, which is the main window, will appear. Users can navigate to various sections from here.
Step #2: Create a new brand and campaign
We’re assuming you’re just getting started on Replug. So, you should set up your brand and campaign to get started with tracking leads.
However, it’s best to start analyzing or accessing the analytics section after at least a couple of weeks for results.
Anyway, click on the Manage button from the top menu bar and select the Brands option.
This is where you create a Brand. All you have to do is fill out the form and provide the brand details, and you’re good to go.
Head over to the Manage section from the top menu, and now click on the Campaigns option from the drop-down menu.
It’s time to create a new campaign. Click on the New Campaign button on the Campaigns page.
Just remember to choose the brand name you just created for this campaign.
The next up is the Select Campaign Type section where you enter the campaign name, select the custom domain if available, and select the campaign’s type.
Choose the Call-to-Actionoption from the Widgets section.
As soon as you choose the Call-to-Action from the widgets, a CTA will pop up.
Press the next button and go to the CTA Style area. This is the area where you can choose the CTA type, such as button, link, or form, select the CTA style, and upload the image.
Since you’re tracking leads using Replug, select the Form option and choose the email service provider you have already integrated with your Replug account.
Once done, hit the next button.
The next section is called the Call-to-Action Message section, where you can add a headline, message body, CTA button text, and the destination URL.
Go ahead and press the next button. You’ll now land on the Call-to-Action Customization section, where you can choose the call-to-action text and button colors.
In the end, there is the setting for the call-to-actions popping up; choose the number of seconds after it should appear or select the exit intent to ensure that the pop-up appears when the visitor is leaving the website. Now, save the CTA campaign.
Step #3: Track leads using the Replug analytics
After several weeks, when you’re ready to track leads, log in to your Replug account and get ready to analyze the leads.
Go to the Measure section from the top menu bar on the dashboard and choose the Analytics option.
Start by adjusting the analytics view. You can choose either the List View or the Detailed View. It’s better to choose the detailed view, though.
Now, adjust the parameters, such as the brand, campaign, and form, to retrieve the required lead tracking data.
Now, you’ll be able to see the leads generated through Replug.
Boost your conversion rates with irresistable CTAs with
Digital analytics tools refers to any website and app statistics tools that reports on the performance metrics, such as page views, unique visitors, unique clicks, conversion rate, referrals, etc. These analytics tools can be used to track leads now.
Usermaven is a state-of-the-art website and app analytics tool that provides a handful of engagement and conversion statistics. It’s a complete analytics toolkit for tracking unique hits, page views, events, conversions, etc.
Here’s how you can track leads using the Usermaven tool:
Step #1: Log in to your Usermaven account
First things first, sign up for a Usermaven account if you still need to do so. Once you’ve signed up, you’re all set to log in to your account.
Use your login credentials to sign in.
Step #2: Create a conversion goal
Now, go to the Attributes section from the sidebar and look out for the conversion goal feature.
You’ll land on the conversion goals page – click the Create Conversion Goal button to start creating your first conversion goal.
The conversion goal creation page will appear now.
Choose a conversion goal name and select the event. For instance, In this case, where you’re tracking leads for a request submission form, you can choose the Page URL option.
The next bit is very important: you can simply add the condition “is” and provide the “Successful submission” page URL.
What it means is that the conversion is recorded when a visitor lands on the “Successful submission” page – the visitors are supposed to visit the “Successful submission” page only after submitting the request form.
Therefore, the conversion goal would be completed.
Fill up the form and finish creating the event.
Step #3: Track conversion goal
Give your conversion goal a good few weeks before hopping on the analytics section.
Access the Usermaven account for at least three to four weeks.
Once logged in, go to the Website Analytics section and look out for the conversion goal section – you’ll see the conversion goal data.
So, that’s how you can track leads using Usermaven.
Here are some of the best lead-tracking best practices:
Fine-tune your lead sources to generate more leads by focusing on the channels that yield high-quality prospects. Avoid spreading your efforts thin across every possible channel, especially if your target audience doesn’t frequent those channels.
Set crystal clear goals to steer your marketing and sales strategies. Your approach will be shaped by whether you aim for more customers, higher sales per customer, or sales of higher-margin products.
Map out your process, even if it seems informal. Whether you use sticky notes, email folders, old spreadsheets, or rely on someone with an excellent memory, recognizing and organizing your current process is crucial.
Prepare a tailored message for the targeted audience. Understand the needs of leads at various stages to develop a relevant strategy. Simply sending a monthly email blast won’t effectively nurture your prospects toward a purchase.
Create customer segments to benefit marketing, sales, and customer service teams. Create content and messaging tailored to each segment’s needs to enhance engagement and effectiveness.
Nurture your captured leads effectively by tracking their position in your pipeline and sending content that matches their current needs. Keep leads engaged with personalized emails that guide them toward a purchase, such as cart abandonment reminders or sales demo offers.
5 best lead tracking tools
Let’s take a quick look at some of the best lead-tracking tools:
Best lead tracking tools
Descriptions
Replug
A powerful link management tool that offers several URL management features including URL shortening, advance tracking, CTA’s, lead tracking, deep linking, and more.It’s an all-in-one solution for generating, managing, and tracking short, branded URLs. It allows users to create and track short URLs for social media, PPC ads, email marketing, and other marketing campaign.
Usermaven
Usermaven is an advanced website and app analytics tool that assists SAAS and online businesses in monitoring their website or app statistics and data.A powerful analytics tool gives an inside-out report on the keywords, rankings, page views, unique hits, and other essential website tracking metrics.
Hubspot
Hubspot is a powerful CRM tool that offers a complete suite for customer management. It has a lead-tracking system that allows businesses, agencies, and entrepreneurs to track leads.
Pipedrive
Pipedrive is a comprehensive lead management tool that keeps track of the leads using its advanced CRM products.
Freshworks
Freshworks is an AI-powered, user-friendly CRM tool that serves thousands of businesses in the lead generation and tracking areas.
Mistakes to avoid when tracking leads
Here are some of the common mistakes when tracking leads:
The lack of categorization in lead generation often causes confusion and inefficiency in follow-ups and tracking.
Keeping the recorded lead data is crucial to the follow-ups. Failing to update lead information regularly can result in outdated and inaccurate data, which could hinder the lead-tracking process.
Lead tracking sources are vital to the whole process. Overlooking lead source tracking makes it difficult to evaluate the effectiveness of marketing campaigns.
Every lead is different than the other. Ignoring inactive leads instead of nurturing them can lead to missed opportunities.
A huge mistake beginner marketers make is that don’t set reminders for the follow-ups, which can result in lost leads due to delayed responses.
Utilizing effective lead generation and tracking software gets the job done quite well. Relying solely on manual tracking increases the risk of human error and data loss.
It’s necessary to prioritize the leads based on their potential. Failing to prioritize leads based on their potential value can waste time on low-value prospects.
CRM integration helps the lead-tracking process. Unable to configure the lead tracking campaign with a CRM system can lead to fragmented and incomplete data.
Maximize marketing ROI
by transforming ordinary URLs into branded short links that convert.
Try Replug for free
Get started with lead tracking
SAAS companies, software houses, online website-based tools, and Shopify plugin developers should pay close attention to lead tracking.
One of the reasons why these businesses should adopt lead tracking is that their competitors might already be doing it. As a general rule of thumb, if your competitors are doing something, you shouldn’t ignore it either.
Are you ready to get started with lead tracking? We hope this piece of content will help you step on the right foot.
FAQs about lead tracking
Allow us to answer some of the frequently asked questions about the lead track:
What is the best way to track leads?
There are numerous ways to track leads that are quite effective in most niches, such as CRM-based tracking, UTM tracking, and setting up promo codes.
What is the cost per lead tracking?
The cost per tracked lead depends on the total cost of the campaign and the number of total leads tracked. All you need is to divide the total cost by the number of leads tracked.
What is CRM lead tracking?
It’s a lead-tracking system that utilizes the power of a CRM tool. Most CRMs offer a complete marketing and engagement toolkit and lead tracking is one of the tools available in the CRM.
How do you track lead quality?
The quality of the tracked lead depends on the tactics and strategies used to find and bring it into the funnel. The next up is to nurture the quality leads. If a tracked lead is unresponsive and doesn’t respond, then it’s a red flag.
Want to know the secret to creating text links that people can’t resist clicking? Read on to discover the strategies that work.
This article will explore strategies for creating high-performing text links that deliver tangible results for your business.
Here you will find tools to create text links, tips, benefits, and much more regarding text links. Let’s not waste any more time and get you started.
What are text links?
Text links are interactive text elements that take users to a different destination or resource when clicked, which can be within the same page or on another page.
Besides that, these links are often highlighted and underlined to make their clickable nature obvious.
A complete link management solution
for marketing professionals & agencies.
Try Replug for free
Why are text links important?
Below are some of the major benefits that highlight the importance of text links;
Helps you get more traffic: Text links guide visitors to different parts of your site, potentially increasing the number of people who find and explore your content.
SEO benefits: Search engines crawl and index pages using text links, influencing your site’s ranking.
User experience: Thoughtfully placed text links make it easier for users to navigate and find valuable content.
Build trust: Backlinks from other trusted websites can make your website look more reliable. Knowing how to find backlinks and tracking them is crucial for improving your website’s credibility and authority, as sometimes you can get backlinks from low-quality website as well.
Common text link errors to avoid for better engagement and SEO
Avoid these pitfalls to optimize your website’s performance:
Mistake
Description
Ignoring anchor text
Descriptive anchor text improves search visibility and user understanding. Don’t use generic terms like “click here.”
Over-optimizing anchor text
Keyword stuffing in anchor text can harm your rankings. Maintain a natural balance.
Neglecting internal linking
Connect related content within your website for better navigation and SEO benefits.
Broken links
Broken links frustrate users and damage your website’s credibility. Regularly check and fix them.
Poor link placement
Consider where you place links. A call-to-action should be prominent, while informational links can be less conspicuous.
How can i create and track a text link?
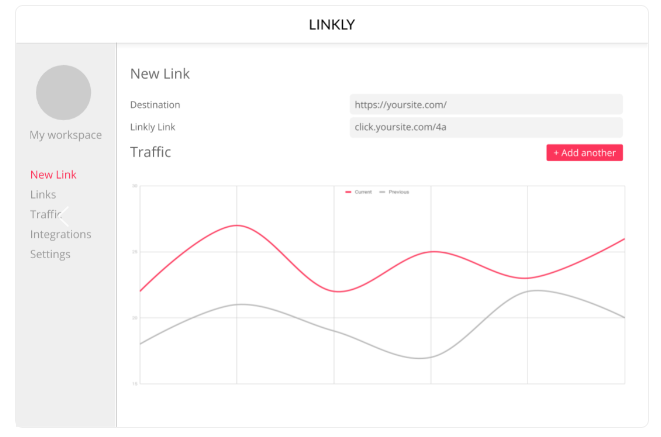
The easiest way to create and manage text links is by using a link shortener tool.
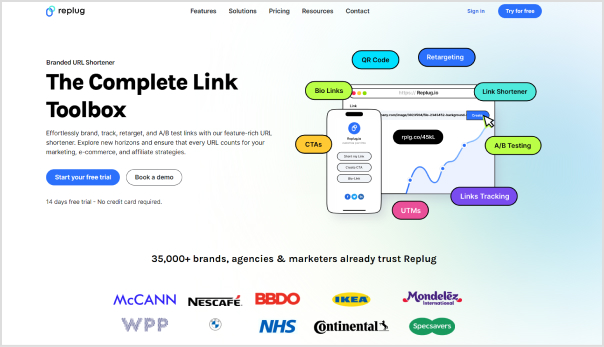
Replug stands out with its comprehensive link management features, which allow users to shorten and customize links easily.
We recommend Replug, particularly for brands, agencies, and marketers, as it offers high-end features for customization, performance tracking, and insights—all in one platform. It’s an excellent tool for creating professional links and understanding their effectiveness.
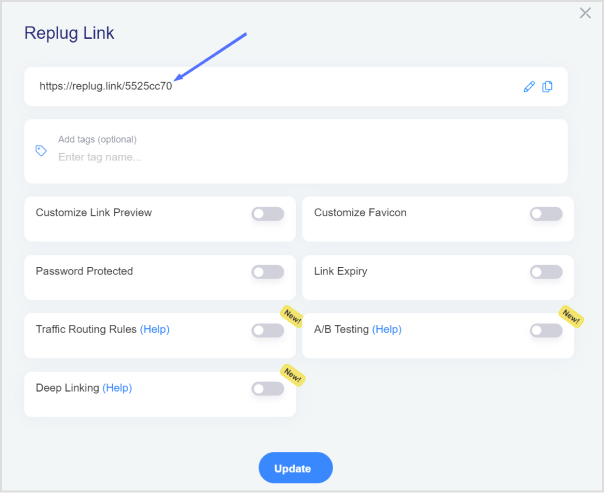
Here’s how you can generate and track a text link with Replug:
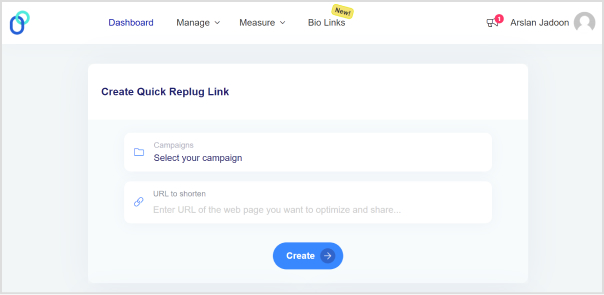
Choose or create a campaign: On your dashboard, select an existing campaign or set up a new one.
Shorten your URL: Enter the URL you want to shorten in the “URL to shorten” section under your chosen campaign, and click “Create.”
Customize your link: After shortening, you can add a custom alias by clicking the edit icon. This makes your link more memorable and shareable.
Copy and use: Copy the newly generated link, hit the update button to save changes, and you’re all set.
Note: In HTML, Use the shortened URL as the ` href ` value within an ` <a> ` tag, and specify the anchor text.
Track performance: Return to your Replug dashboard to monitor your link’s performance, including click-through rates and other useful analytics.
In summary, while Replug focuses on shortening and managing your URLs, adding hypertext is done through the context where you’re using the URL, such as in HTML code or within content editors.
Maximize marketing ROI
by transforming ordinary URLs into branded short links that convert.
Try Replug for free
Best practices to follow when creating text links
Clear and relevant anchor text: The text used for the link should accurately describe the destination page. For instance, “Learn more about our products” is better than “Click here.”
Keyword optimization: Incorporate relevant keywords into your anchor text to improve search engine visibility. However, avoid keyword stuffing.
Link placement: Consider where the link is placed within your content. A call-to-action link should be prominent, while links for additional information might be less conspicuous.
Link appearance: Customize the link’s appearance (color, font, underline) to match your website’s design and make it stand out.
Regularly monitor and analyze data: Identify trends and optimize your links accordingly.
Experiment with different anchor texts and link placements: To find what works best for your audience.
Additional tips
Internal linking: Link to relevant pages within your website to improve navigation and SEO.
External linking: Link to authoritative external sources to establish credibility.
Mobile optimization: Ensure your links are easy to click on mobile devices.
Link attribution: Accurately attribute link clicks to the correct marketing channels.
Conclusion
Creating and tracking effective hyperlinks is a cornerstone of successful online marketing. By following the strategies outlined in this guide, you can enhance user experience, boost SEO, and drive conversions. Remember, the key to success lies in crafting clear, relevant, and visually appealing links that align with your audience’s needs. Continuously monitor and analyze your text link performance to refine your approach and maximize results.
FAQs on text links
Can I use too many text links on a page?
Yes, excessive use of text links can distract users and negatively impact readability. Aim for a balance that enhances content without overwhelming visitors.
How often should I update my text links?
Review your links regularly to ensure they remain accurate and relevant. Update broken links promptly, and consider refreshing anchor text for better SEO.
How can I add an anchor link to my URL?
Add an anchor by including an id attribute in the target element, and then use #id in your hyperlink. For example: <a href=”#section1″>Go to Section 1</a>.
What are the three types of hyperlinks?
The three types are hyperlinks, internal links (to the same site), external links (to other sites), and anchor links (to specific sections within the same page).
What is the ideal length for anchor text?
There’s no strict rule for anchor text length. Focus on clarity and relevance. Generally, concise anchor text is preferred.
Should I use the same anchor text for multiple links?
While it’s not harmful to occasionally use the same anchor text, varying it can improve SEO and user experience.
Mixpanel, Usermaven, Amplitude, Heap, Kissmetrics, and the list of product analytics tools go on…
Can’t decide where to stop your search? Well, this blog might end your search for the best product analytics tool. We’ve got you covered with comprehensive discussions on all aspects of analytics software.
To ensure we recommend the best fit for you, we evaluated the product analytics platforms mentioned below through a multi-step process.
First, we analyzed user reviews and satisfaction scores on G2, a trusted platform for software reviews.
We then conducted hands-on testing, exploring features and user interfaces to assess their suitability for different needs and technical skill sets.
Finally, we created a detailed feature comparison to identify which tool excelled in areas like automated tracking, funnel analysis, and data visualization
Key Takeaways:
Factors to consider:
User interface, budget, scalability, customizable dashboards, free trials, reviews, integrations, and privacy.
Top choice: Usermaven
Usermaven stands out with its advanced features, ease of use, affordable pricing, and strong data privacy compliance.
Best product analytics platforms – comparative analysis
Usermaven vs Mixpanel:
Usermaven offers AI insights, no-code event tracking, and better data privacy.
Usermaven vs Amplitude:
Usermaven provides real-time data, personalized support, and affordable pricing.
Usermaven vs Heap:
Usermaven is beginner-friendly and more affordable, especially for small businesses.
Usermaven vs Kissmetrics:
Usermaven excels in data retention, advanced features, and customer support.
Usermaven vs Pendo:
Usermaven offers a broader set of features and focuses on real-time data and AI insights.
Usermaven vs Posthog:
Usermaven is easier to use and excels in real-time data visualization.
Usermaven vs Quantum Metrics:
Usermaven offers detailed user journey mapping and other analytics.
Usermaven vs Woopra:
Usermaven provides AI-powered insights and lower costs, making it accessible for wider team participation.
8 benefits of using product analytic tools
The above part was just a drop in the bucket. Now we’ll talk ‘business’. We’ll show you some of the best benefits of using product analytics tools.
By utilizing this product analytics tool, product owners and managers, UX designers, product engineers, and marketers can significantly reduce the time required for their tasks.
Packed with a multitude of features, Usermaven is the ultimate product analytics platform that surpasses other tools. Get a fast and user-friendly interface, scalable pricing based on events, exceptional customer support, etc., and thank us later.
And if privacy is your top priority, then this platform is just perfect for you. It excels in this aspect by fully complying with GDPR & CCPA and ensuring the protection of user data.
What’s in it for you?
There’s a lot in it for you… Let’s start with the key features.
Convenient dashboard
Gain instant clarity into key metrics with a user-friendly interface, allowing you to focus on what matters most. It pulls together all the key stats, like user acquisition by channel, DAU/MAU, feature usage, most engaged users, and much more.
Automated event tracking
Automated event tracking makes life easier by automatically keeping track of what users are doing in your app. No need to manually set up tracking for every click or page view—it’s all handled for you.
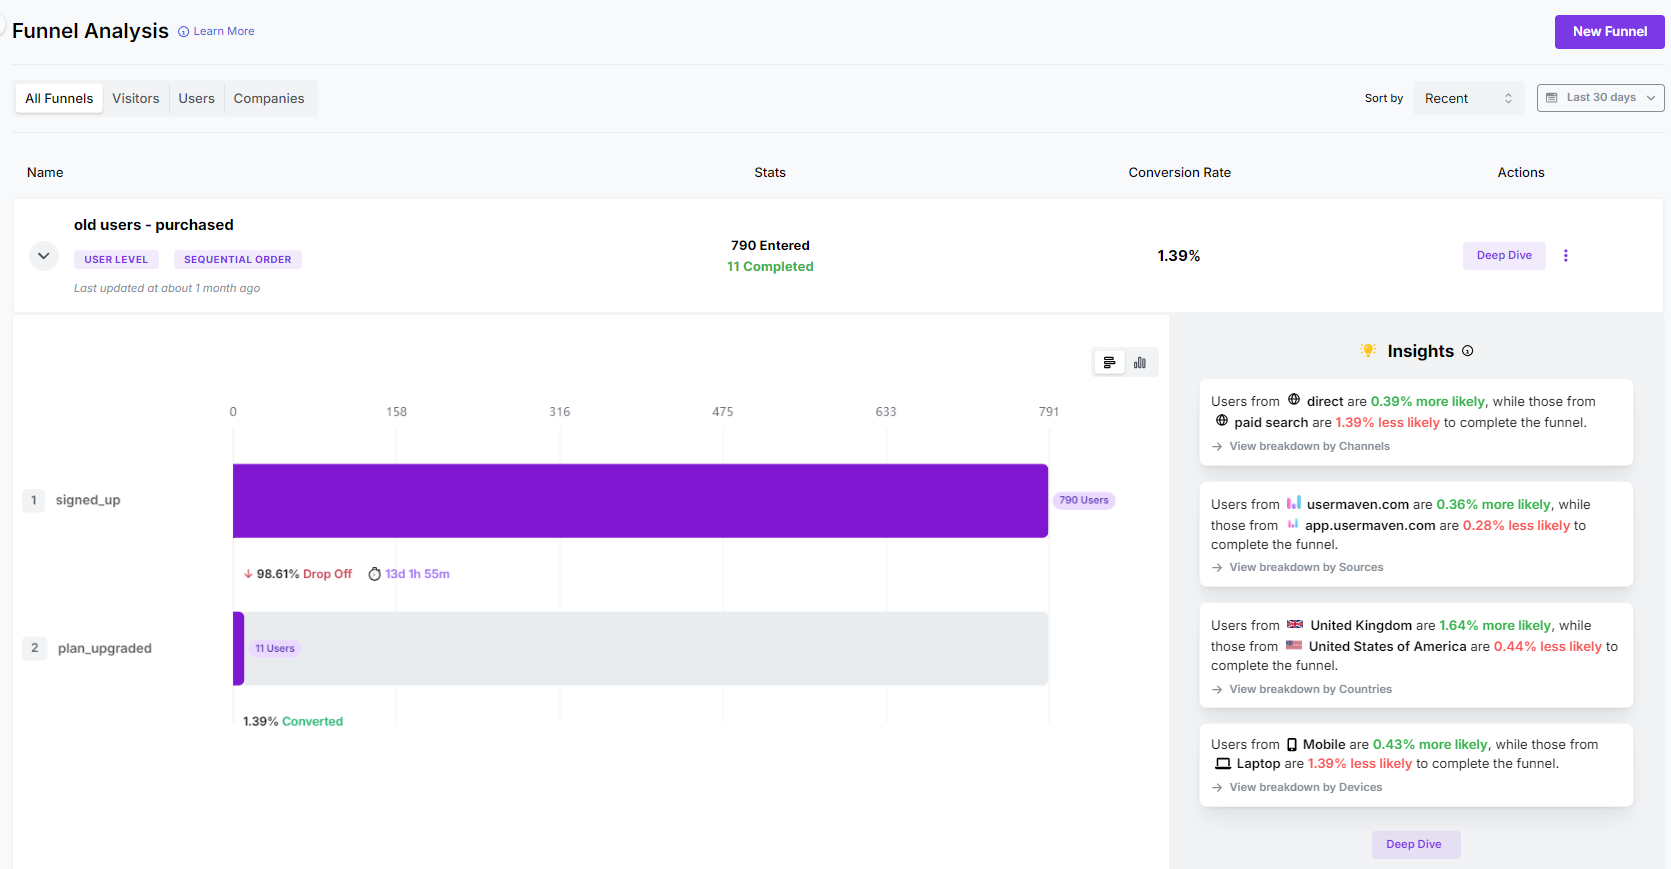
Funnel analysis
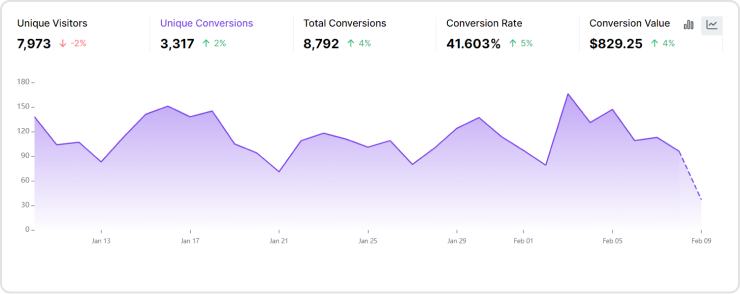
Usermaven’s funnel analysis breaks down the steps your users take to achieve a goal, like making a purchase or signing up. You can get a hold of conversion rate, average time spent, drop-off rate, etc.
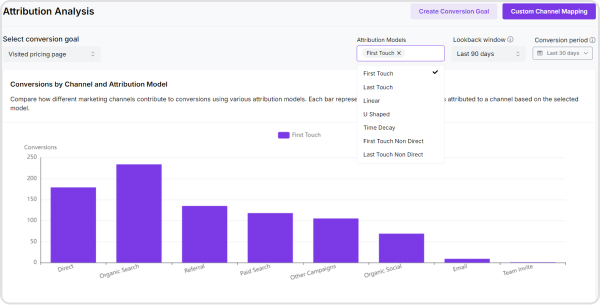
Granular attribution analysis
Multi-touch attribution helps you pinpoint which marketing channels are driving the most conversions. You can analyze data using the following attribution models.
First touch
This credits the very first channel a user interacted with on their conversion journey.
Last touch
This assigns credit to the last channel a user interacted with before converting.
Linear
This acknowledges that users often interact with multiple channels before converting and assigns equal credit across those touchpoints.
U Shaped
This model gives 40% weightage to the first and last channel involved in conversions during the customer journey.
Time Decay
This model assigns more weight to touch points closer to the conversion and gradually reduces credit for earlier interactions.
First touch non-direct
This is just like the first touch attribution model, but it excludes the direct traffic channel if it occurs at the first touch.
Last touch non-direct
This is just like the last touch attribution model, but it excludes the direct traffic channel if it occurs at the last touch.
Compare the behavior of different user groups acquired at different times. This helps you understand user trends and measure the long-term impact of product changes.
Feature adoption reports
Feature adoption reports give you a clear picture of how new features are being used. They show you which features are hitting the mark and which ones need tweaking. With these insights, you can make informed decisions about future developments.
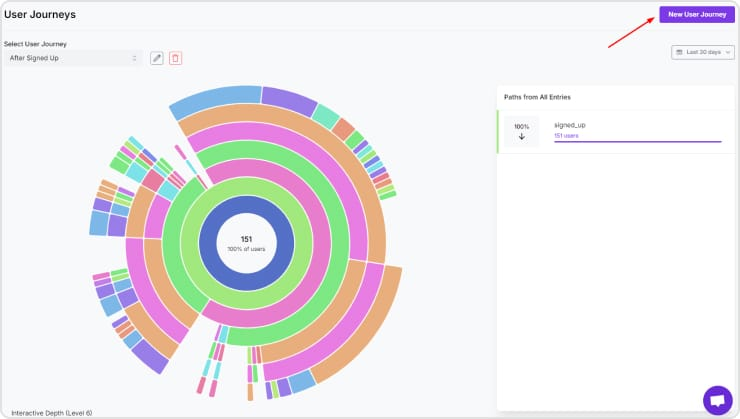
Visualize the user journey.
Visualizing the user journey is like mapping out the path users take through your product. It shows you the common routes they follow and highlights any spots where they might get confused or stuck.
Seeing this journey laid out visually helps you understand how users interact with your product and where you can make changes to create a smoother, more enjoyable experience for them.
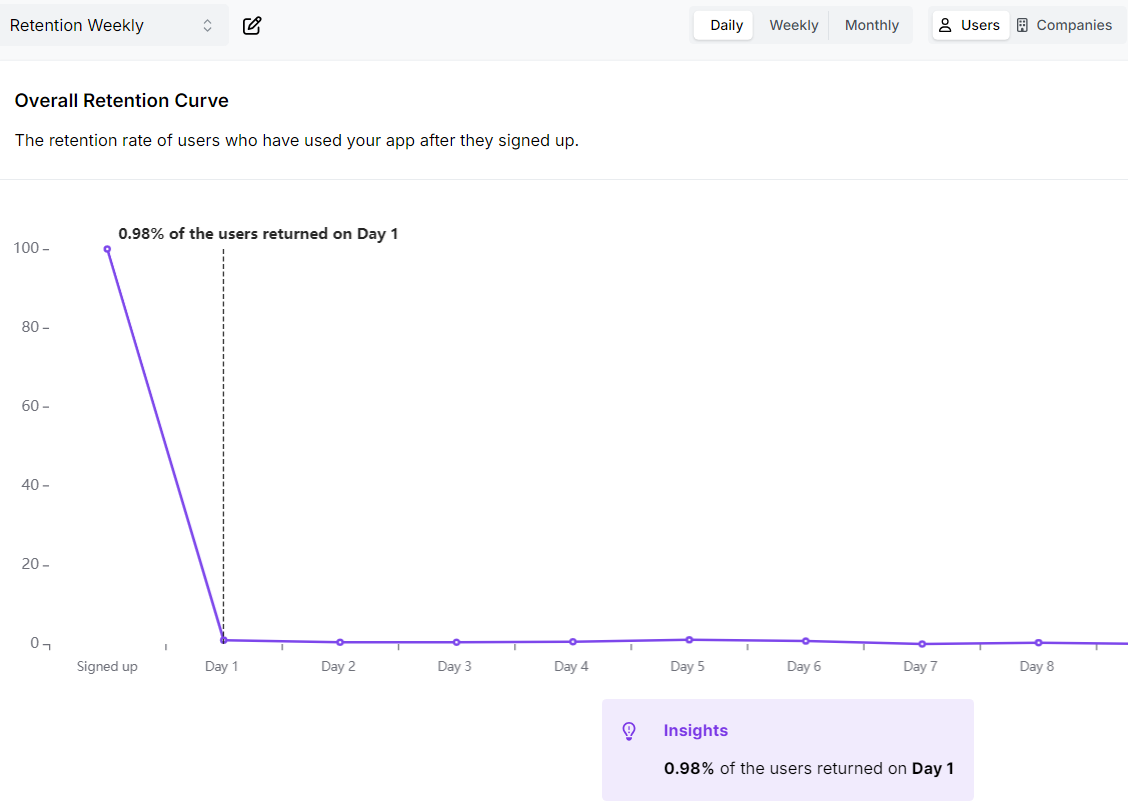
Retention data tracks how many users continue to use your product over time. It helps you understand the stickiness of your product and identify patterns in user behavior. By analyzing retention rates, you can determine what keeps users coming back and address issues causing churn.
Engagement data
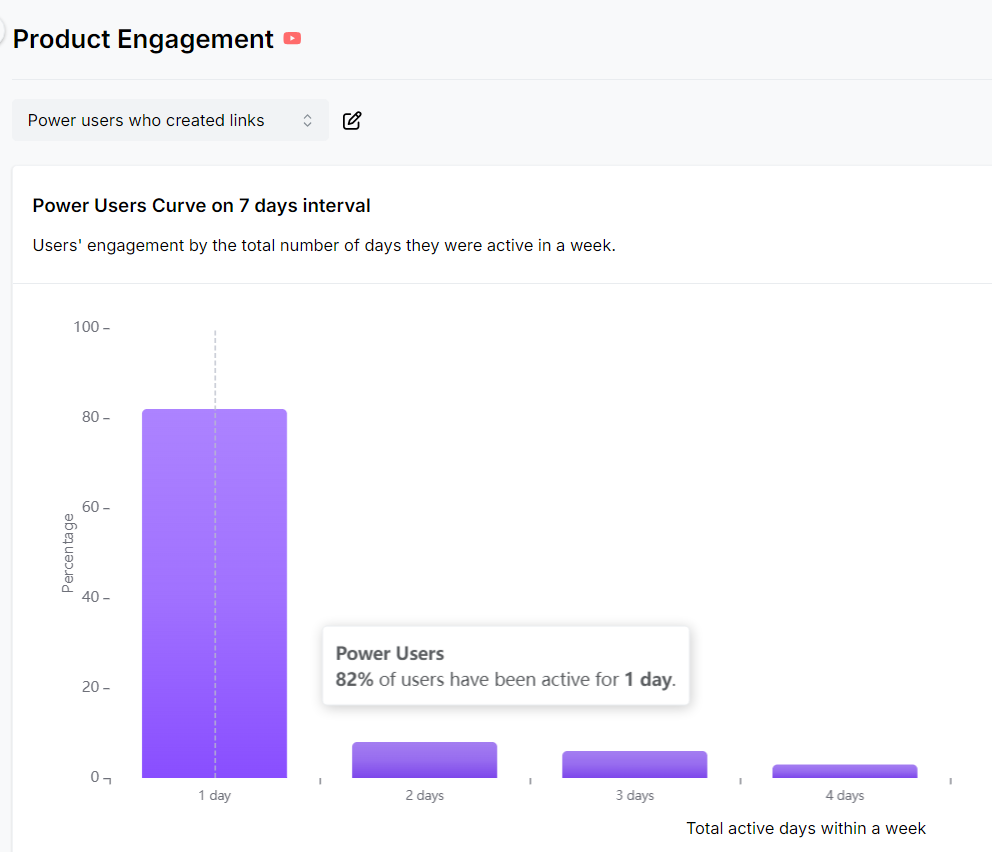
Engagement data measures how actively users interact with your product. It includes metrics like session frequency, duration, and feature usage. This information helps you gauge user interest and identify which aspects of your product are most engaging.
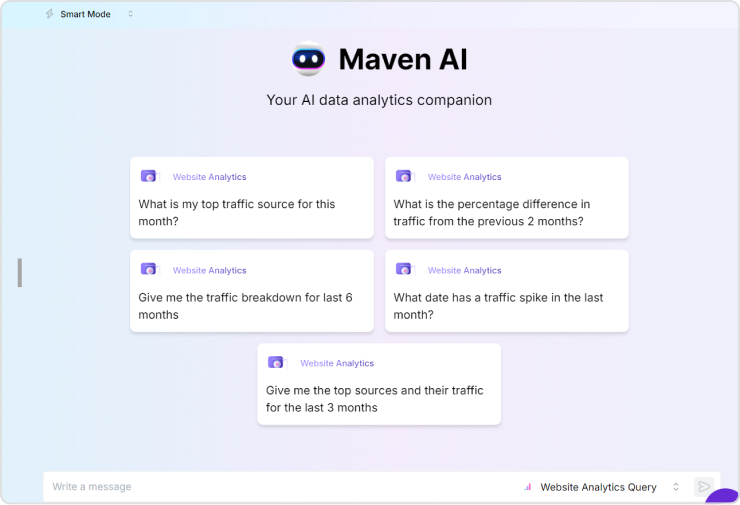
Go beyond basic data with Usermaven’s Maven AI tool, an intelligent data assistant. It provides actionable recommendations to optimize your SaaS analytics. Simply ask questions using natural language, and Maven AI delivers precise answers.
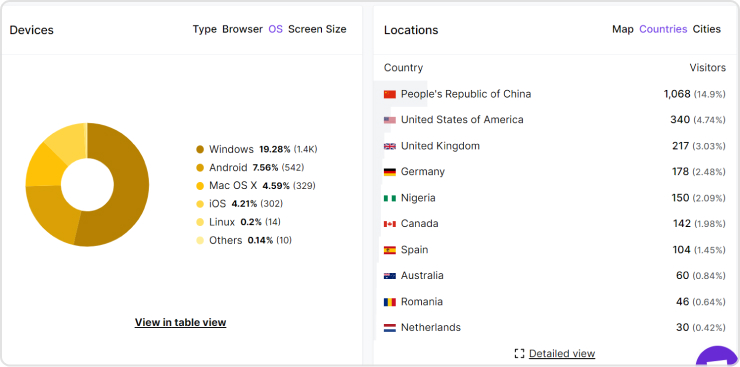
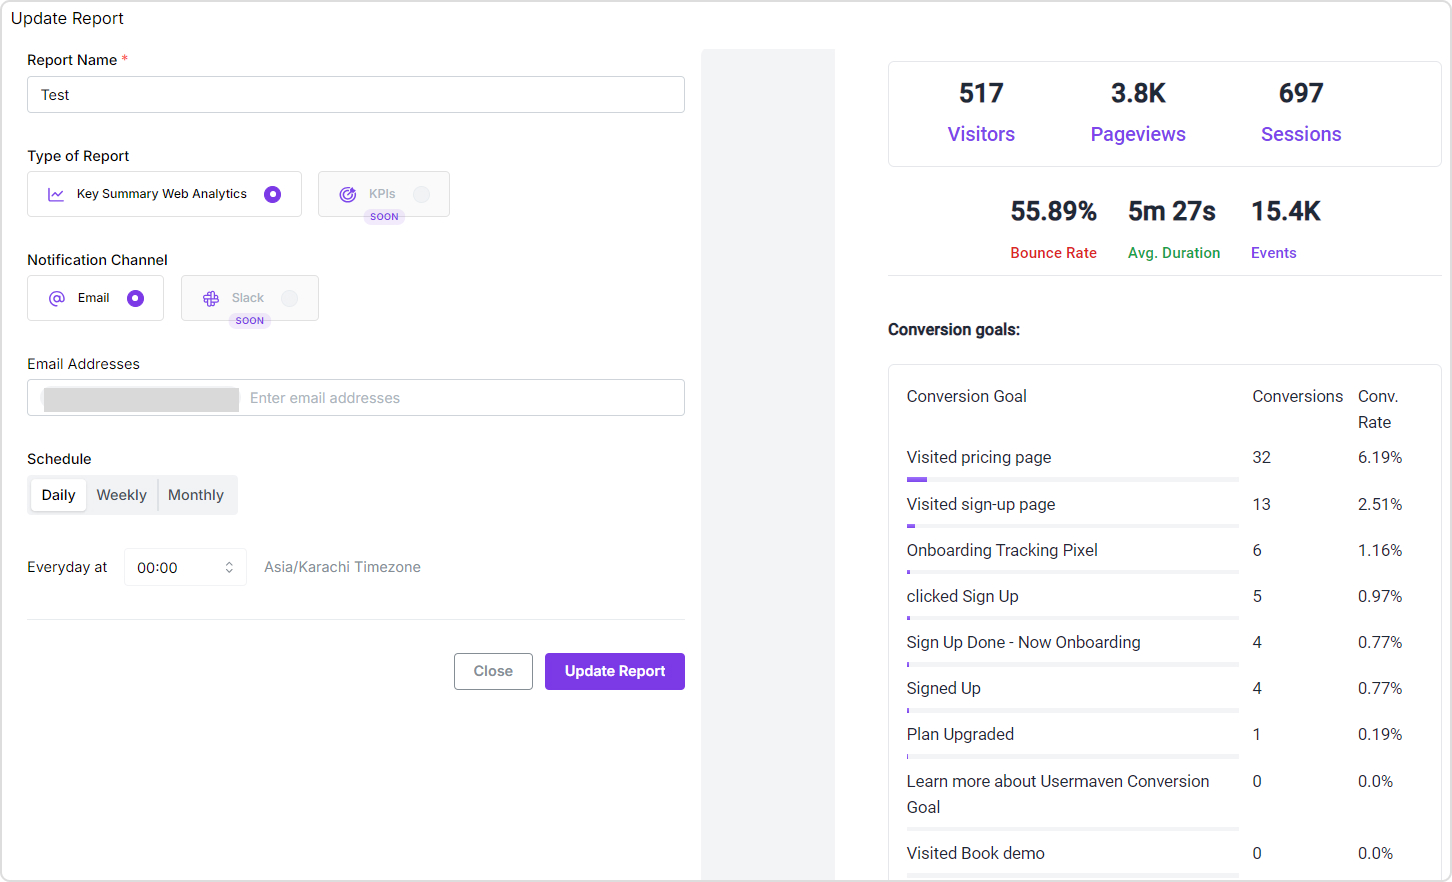
What else? Forget fumbling with multiple tools – Usermaven is your one-stop shop for understanding how users interact with your product and website. See which marketing campaigns bring in the most visitors by tracking UTM parameters. Or set and conversion track goals for key actions like sign-ups, purchases, and downloads, so you know what’s working. Besides that, enjoy features like content tracking, bounce rate, first-party pixel connection, total sessions, total events, heatmaps, audience demographics, referral sources, and mobile vs. Desktop analytics.
Best for: Teams who prefer features like custom dashboards, custom event tracking, and quick reports.
Why choose this product analytics tool?
Mixpanel helps app creators understand the why of analytics! By tracking how users tap, swipe, and click, Mixpanel exposes what works and what flops and creates a product that your users will love.
Custom event tracking: This allows you to set up custom events within your app to monitor specific user actions.
User group targeting: Group users based on their behavior and tailor your app experience to keep them happy.
Fast onboarding insights: See how well users navigate that initial app setup. Identify any onboarding roadblocks and smooth the way for new users.
Feature adoption reports: Track how users engage with new features. This helps you see what’s working, what flops, and where to improve.
Remember that Mixpanel may not offer full control over your data privacy and lacks auto-capture event tracking. Moreover, its custom pricing structure, particularly for larger companies, could lead you to explore Mixpanel alternatives.
Best for: Large teams and enterprises needing in-depth behavioral insights.
Why choose this product analytics tool?
Amplitude, an event-based analytics platform founded in 2012, stands out as a premier choice for businesses looking to deeply understand user behavior and optimize their digital products.
Customizable dashboards and reports: With Amplitude, users can create customized dashboards and reports that suit their specific needs. The intuitive interface allows for easy visualization of key metrics, making it simple to track performance and share insights with stakeholders.
Wide integration capabilities: The platform integrates seamlessly with a variety of other tools and platforms, such as Slack, Salesforce, and Google Analytics.
Pathfinder reports: Pathfinder reports provide detailed insights into user behavior, helping businesses uncover hidden patterns and opportunities for improvement.
Retention analysis: By analyzing retention data, product managers can identify which actions or behaviors lead to long-term engagement and customer loyalty.
Best for: Teams looking for a detailed user journey mapping.
Why choose this product analytics tool?
Heap, a cloud-based data analytics platform known for its high-end feature set and customization capabilities. It provides real-time analytics by tracking every user interaction on the web or app, highlighting the user’s digital journey which businesses can use to improve customer retention. Here are some important points:
Complete user behavior visibility: Unlike traditional analytics tools that require predefined event tracking, Heap provides retroactive analysis. This means you can explore and analyze user behavior even if you didn’t set up tracking beforehand.
Segmentation and personalization: It enables segmentation based on user attributes and behaviors, empowering you to personalize user experiences and target specific user groups.
Collaboration and sharing: Heap facilitates collaboration by allowing team members to easily share insights and reports, fostering a data-driven culture across your organization.
Despite its strengths, Heap has some notable drawbacks. It has a steep learning curve, limited segmentation capabilities, poor customer support, high pricing, and complex integration processes. These issues may lead businesses to consider alternative analytics tools.
Best for: Businesses focused on improving user retention and conversion.
Why choose this product analytics tool?
Kissmetrics, another well-known name in the product tool industry, was initially developed by Neil Patel and Hiten Shah, particularly for e-commerce businesses. Kissmetrics offers a range of features including:
Funnel reports: With Kissmetrics, you can create and analyze conversion funnels to track user journeys through various stages of your sales or conversion process.
Cohort analysis: It offers powerful cohort analysis capabilities, allowing you to group users based on shared characteristics or behaviors and track how these cohorts perform over time.
Customer lifetime value (LTV) analysis: Kissmetrics helps businesses calculate and analyze the lifetime value of their customers.
Wide integration capabilities: It offers integrations with a wide range of third-party tools and platforms, including CRM systems, email marketing software, and customer support platforms.
While Kissmetrics provides many useful features, it comes at a higher price point than some of its competitors. This can be a barrier for small businesses or startups with limited budgets.
Best for: Teams needing full data control and customization.
Why choose this product analytics tool?
The next on our list is Posthog, an analytics tool that gives a strong challenge to Usermaven as both tools offer a comprehensive suite of features. Posthog is ideal for teams who need in-depth user insights and the ability to run experiments for optimization. Besides that, it also allows integrations with popular marketing and analytics platforms.
Self-hosted or cloud-hosted options: PostHog gives you the flexibility to deploy it either on your infrastructure (self-hosted) or use their cloud-hosted service, depending on your preferences and requirements.
Feature flags and A/B testing: It includes feature flags and A/B testing capabilities, allowing you to safely roll out new features and experiment with different variations to optimize user experience and conversions.
API and integrations: It provides API and supports integrations with various third-party tools and platforms, allowing you to centralize your data and extend PostHog’s functionality as needed.
Best for: Teams focused on user onboarding, engagement, and collecting user feedback.
Why choose this product analytics tool?
Pendo offers a well-rounded product analytics suite with a strong focus on user onboarding, engagement, and feature adoption. In easier words, it excels at guiding users through product features with walkthroughs and tooltips and provides insights into feature usage.
In-app surveys: Gather real-time feedback directly from users through customizable in-app surveys. Trigger surveys based on user behavior to collect targeted, relevant feedback.
In-app guidance and messaging: Create step-by-step walkthroughs, tooltips, and banners to help users navigate your product. Enhance user experience and reduce support requests with proactive guidance.
Feature adoption reports: Understand how users interact with your product’s features through detailed adoption reports. Identify popular features and areas needing improvement or additional guidance.
Best for: Teams focused on rapid product iteration and improvement.
Why choose this product analytics tool?
Quantum Metrics is a user analytics platform geared towards businesses with a large user base and development teams. It utilizes artificial intelligence to analyze vast amounts of user data, automatically pinpointing areas where users encounter friction or frustration. This focus on automation allows for quick identification of conversion roadblocks and usability issues.
Some of its prominent features include:
Revenue attribution: Understand how different user groups and behaviors contribute to revenue.
Error monitoring: Automatically detect and monitor errors that users encounter on your site or app. Quickly address and resolve issues to improve user experience and reduce frustration.
Journey analysis: Visualize and analyze user journeys to understand the paths users take through your site or app.
Session replay: Watch recordings of user sessions to see exactly how users interact with your site or app. This helps in understanding user behavior and identifying pain points.
Best for: Organizations seeking to analyze user behavior across all digital channels to optimize customer experiences and drive growth.
Why choose this product analytics tool?
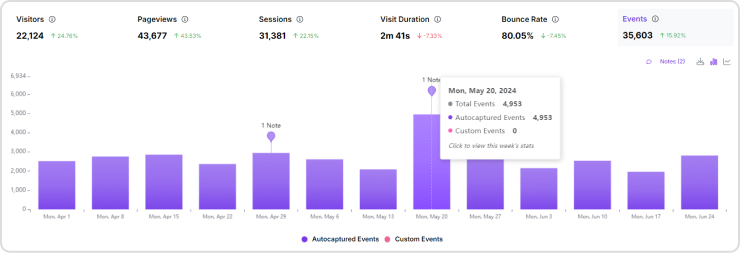
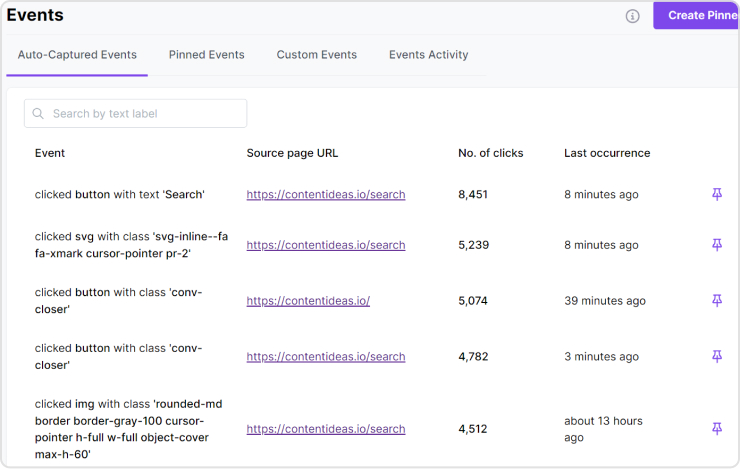
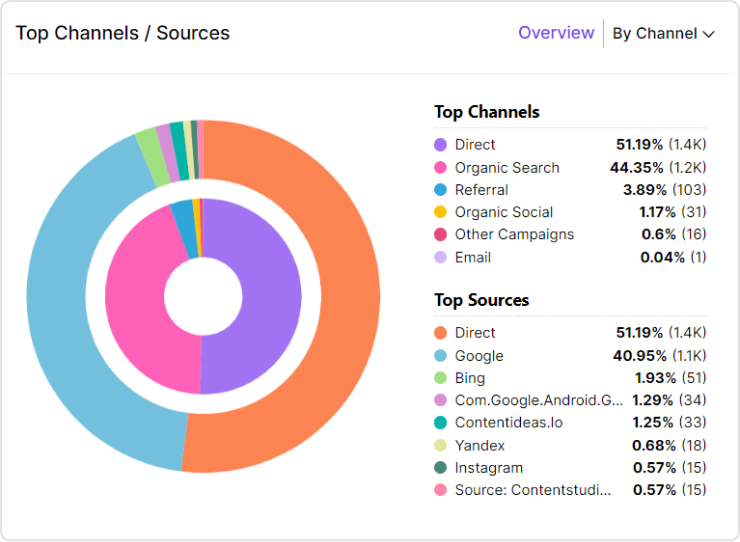
Lastly, we have Woopra renowned for its real-time customer analytics, enabling businesses to track and analyze user behavior as it happens.
Real-time reporting: Get insights into user behavior as it happens. This allows you to identify and address any issues immediately, optimizing your product for maximum impact.
Powerful funnels & journeys: Identify drop-off points within your sales or onboarding funnels. Woopra’s journey mapping helps you visualize the complete customer path and identify areas for improvement.
However, Usermaven provides so much more alongside AI-powered insights, and potentially lower cost (depending on usage) could be advantageous for businesses seeking a comprehensive analytics platform that doesn’t require constant monitoring.
You might have heard that there isn’t one “best” product analytics platform since the perfect choice varies depending on your requirements and priorities.
However, we don’t think the same. Through extensive research and testing of analytics tools, we have concluded that Usermaven (a digital analytics tool offering website and product data) is undoubtedly a top choice among other analytics software.
Must-have factors to look out for in product analytics tools
With a wide range of product analytics tools available, choosing the right one can be overwhelming. A well-structured product management checklist can help simplify this decision by outlining essential features and requirements. Here are some of the most important things to keep in mind.
Key factors to consider
Description
User interface
Opt for an intuitive interface that makes it easy to explore and understand your data. A user-friendly design streamlines decision-making and analysis.
Budget and scalability
Consider your budget and growth plans. Choose a tool with transparent pricing and scalable features that can grow with your business needs.
Customizable dashboards
Find a tool that lets you create dashboards tailored to your specific metrics and reporting needs. This way, you can focus on what matters most to your business.
Free trails or demos
Take advantage of free trial periods to test the tool’s functionalities firsthand. Free trials allow you to assess compatibility with your business needs and evaluate ease of use before making a commitment.
Reviews and ratings
Research user reviews and expert ratings to gauge the tool’s performance, reliability, and customer support. Insights from other users provide valuable perspectives on real-world usability and satisfaction.
Integrations
Make sure the tool integrates smoothly with other platforms you use, such as CRM or marketing automation software.
Privacy focused
Prioritize tools that uphold robust data privacy and security measures. Look for compliance with industry standards (e.g., GDPR, CCPA) to safeguard sensitive information and build trust with users.
Conclusion
So grab a coffee, ditch the stress, and let’s find your analytics bestie!
As this comprehensive guide cuts through the confusion to reveal the ultimate solution for your needs. We’ve meticulously analyzed and compared top contenders, and guess what? There’s a clear winner!
Usermaven stands out for its comprehensive features, ease of use, and affordability. Its advanced analytics, AI-powered insights, and strong data privacy compliance make it an excellent choice for businesses of all sizes.
Whether you’re a startup or a large enterprise, investing in a tool like Usermaven can greatly enhance your ability to make informed decisions.
Here are a few more that didn’t make the top list but are worth your consideration as an analytics tool.
GA4
Hotjar
FullStory
Indicative
Userpilot
LogRocket
Simple analytics
Baremetrics
FAQs related to product analytics
What are product analytics tools & how do they work?
Product analytics tools are used to collect, analyze, and visually represent data associated with a product. In simple words, product teams and marketers can see how users interact with their digital products.
What are the most common user flows within the product?
Which features are users engaging with the most?
Are there any features with low usage that could be improved or removed?
At what points do users most commonly disengage or abandon their tasks within the product?
And much more because the possibilities for analysis are endless.
What are product metrics?
Product metrics are quantifiable data points that measure various aspects of a product’s performance, usage, and user behavior.
Who uses product analytics tools?
Product managers, UX designers, marketers, and data analysts commonly use product analytics tools. These tools help them make informed decisions based on user behavior and product performance data.
How user-friendly are product analytics tools for non-technical users?
Many product analytics tools offer intuitive interfaces and no-code features, making them accessible to non-technical users. User-friendly designs and AI assistants further simplify data analysis for broader team participation.
How do these tools handle data privacy and GDPR compliance?
Product analytics tools typically include features to ensure data privacy and GDPR compliance, such as data anonymization, user consent management, and secure data storage. They often provide documentation and support to help businesses maintain compliance.
Can these tools track user engagement across different devices?
Yes, many SaaS analytics platforms, can track user engagement across multiple devices. They provide a unified view of user interactions to help businesses understand cross-device behavior.
When to invest in a product analytics tool?
Invest in a product analytics tool when you need detailed insights into user behavior, want to optimize product performance, and aim to drive data-driven decision-making across your team. It’s especially valuable during product growth or transformation phases.
Web analytics tools act as a cornerstone for marketers, but with so many options, it can be hard to choose the right one.
No more confusion!
This blog will tell you all about the best web analytics tools available in 2024.
We’ll compare features, user ratings, and pricing to help you choose the perfect web analytics tool and unlock website growth.
If you keep reading this blog further, in the next five minutes, you’ll have the knowledge to make an informed decision and maximize the value of your website traffic data. Additionally, incorporating Free SEO Tools into your strategy can further enhance your ability to optimize your site, offering cost-effective solutions that improve your search rankings without straining your budget.
Quick overview: Which is the best web analytics tool? Usermaven cuts through website analytics confusion. Get real-time insights, prioritize privacy, and transform data into actions—all with a user-friendly setup and budget-friendly pricing. Boost conversions, improve user experience, and drive online success. Book your demo now!
Must-have features of web analytics tools
Here’s a concise list of the must-have features for web analytics tools:
Real-time tracking: Gain insights into user behavior as it happens.
User behavior analysis: Understand why users act the way they do.
Mobile analytics: Understand how users interact on mobile devices.
E-commerce tracking: Optimize your online store with key metrics.
Heatmaps & session recordings: Visually see how users interact with your site.
A/B testing: Test and optimize your website for better conversions.
Cross-domain tracking: Track user journeys across multiple websites in your domain.
Auto-captured events: Gain insights from pre-defined user interactions without manual setup.
Annotations & notes: Add context to your data for deeper analysis and collaboration.
Integrations: Connect web analytics with other marketing tools.
Data visualization & reporting: Get clear, actionable insights from your data.
Customizable dashboards: Track key metrics at a glance.
Data export options: Analyze data further with other tools.
Top 12 web analytics tools
Here are the top 12 web analytics tools we’ll be examining in detail:
Usermaven
GA4 (Google Analytics 4)
Matomo
Piwik PRO
Plausible
Simple Analytics
Clicky
Fathom Analytics
Chartbeat
Tiny Analytics
Statcounter
Open Web Analytics
Each of these website analytics tools offers unique features and benefits to help businesses understand and optimize their website performance. We’ll dive into each specifics in the following sections. First, let’s see their ratings;
The G2 ratings and Product Hunt ratings for the specified web analytics tools are as follows;
Tool
G2 Rating
Product Hunt Rating
Usermaven
4.9
4.9
GA4 (Google Analytics 4)
4.5
–
Matomo
4.2
4.7
Piwik PRO
4.6
5
Plausible
5.0
4.8
Simple Analytics
4.4
4.9
Clicky
4.5
–
Fathom Analytics
4.6
4.9
Chartbeat
4.4
–
Tiny Analytics
–
–
StatCounter
4.3
5
Open Web Analytics
4.5
–
1. Usermaven
“From data to decisions: Usermaven – Your perfect website analytics partner.”
Usermaven, a solid privacy friendly product and web analytics tool for marketers and enterprises of all sizes. When it comes to website analytics, Usermaven provides a comprehensive suite of features necessary in a web analytics tool for understanding and optimizing website performance.
Key features of Usermaven
Here are the key features relevant to web analytics:
Website metrics: Usermaven tracks the number of unique visitors, total pageviews, number of sessions, average visit duration, and bounce rate to provide insights into website performance and user engagement.
Events: Tracks specific user actions (e.g, clicks, form submissions, video plays) to understand how users interact with different elements of your website. Usermaven shows auto-captured events; you can pin events of your choice and create custom events as well.
Top Channels/Sources: Identifies the most effective marketing channels and traffic sources (e.g., organic search, social media, referrals) driving visitors to your site.
UTM traffic: Analyzes traffic from UTM-tagged campaigns, allowing you to measure the effectiveness of specific marketing efforts and adjust strategies accordingly.
Conversion goals: Sets and track specific conversion goals (e.g., form completions, purchases) to measure the success of your marketing efforts and website performance.
Device location: Provides data on the geographical locations of your visitors, helping you understand your audience’s distribution and target regions more effectively.
Funnels: Funnels enable you to visualize the steps users take to complete a goal (e.g., checkout process), identifying drop-off points and opportunities to optimize the user journey for higher conversions.
Attribution: Track every customer touchpoint across multiple channels to understand the true impact of your marketing efforts. Usermaven offers seven attribution models, including Linear, First Touch, Last Touch, Position Decay, Time Decay (new), First Touch Non-Direct (new), and Last Touch Non-Direct (new), enabling data-driven decision-making.
User journey tracking: Visualize and analyze user paths through your product using Usermaven to identify friction points and improvement opportunities.
Maven AI: Leverage AI-driven insights and recommendations with Usermaven to optimize product performance and user experience.
Comprehensive reports: With the recent overhaul of the Reports feature, you can now schedule reports to be sent daily, weekly, or monthly and specify the exact hour for delivery.
Usermaven offers several pricing tiers to cater to different business needs and those who are looking for an ideal web analytics tool:
Pro: ($14/month) is ideal for businesses and agencies and includes unlimited websites, workspaces, and users, 2 years of data history, website analytics, and more.
Premium: ($24/month) includes everything in Pro plus unlimited data history, SaaS product analytics, multi-touch attribution, etc.
Enterprise: (custom pricing) is designed for businesses with custom requirements and includes everything in Premium.
Reviews
Sr.
What people like about it
What people dislike about it
1.
Like: User-friendly interface and intuitive design.
Dislike: Advanced features require a paid plan.
2.
Like: Excellent customer support and onboarding assistance.
3.
Like: Automated insights and actionable recommendations.
Note: These reviews of web analytics tools are synthesized from various sources such as G2, Capterra, Product Hunt, TrustRadius, Software Advice, and customer testimonials.
2. Google Analytics 4 (GA4)
Google Analytics 4 (GA4) is the latest version of Google’s popular web analytics tool, designed to provide comprehensive insights into user behavior across websites and apps. With enhanced machine learning capabilities and privacy-centric features, GA4 offers a more robust and flexible approach to tracking and analyzing user interactions.
Key features of GA4
Event-based tracking: GA4 focuses on events, allowing for detailed tracking of user interactions beyond just page views.
Cross-platform tracking: It enables tracking of user activity across the web and app, providing a unified view of customer journeys.
Enhanced measurement: Automatic tracking of common events like scrolls, outbound clicks, site searches, and file downloads.
Machine learning insights: Predictive analytics and insights powered by machine learning to identify trends and opportunities.
Debugging and testing: Integrated debugging and testing tools to streamline setup and ensure accurate data collection.
Flexible reporting: Customizable reporting and analysis tools to create tailored insights.
Audience building: Advanced audience segmentation capabilities for targeted marketing efforts.
Integration with Google products: Seamless integration with Google Ads, BigQuery, and other Google products.
User-centric measurement: Focus on user-centric data, enabling a better understanding of individual user journeys.
Pricing plan of GA4
Google Analytics 4 offers two main pricing plans:
Free tier: This plan provides basic features and is suitable for small to medium-sized businesses.
Google Analytics 360: Pricing for GA360 is customized based on business needs.
Reviews
Sr.
What people like about it
What people dislike about it
1
Like: Advanced tracking capabilities and event-based models.
Dislike: Steeper learning curve compared to Universal Analytics.
2
Like: Integration with other Google services.
Dislike: Privacy concerns (non-GDPR compliant)
3
Like: Predictive analytics powered by machine learning.
Dislike: Limited customer support in the free version.
3. Matomo
Matomo is a versatile web analytics tool that offers complete control over data, providing in-depth insights into user behavior and website performance. Matomo emphasizes privacy, data ownership, and customization to meet the unique needs of businesses and organizations.
Key features of Matomo
Open source: Matomo is open-source, giving users complete control over their data and the ability to customize the platform to their needs.
Data ownership: Users own 100% of their data, ensuring privacy and compliance with data protection laws like GDPR.
No data sampling: Provides accurate reports without data sampling, even for large datasets.
Privacy features: Enhanced privacy features, including anonymizing IP addresses and managing user consent.
E-commerce tracking: Comprehensive e-commerce tracking capabilities to monitor sales, conversion rates, and product performance.
Integration with various platforms: Integrates with various CMS, e-commerce, and marketing platforms.
Performance metrics: Detailed insights into website performance, including page load times and server response times.
Pricing plan of Matomo
Matomo offers several pricing plans:
Free on-premise version: Users can download and host Matomo on their own servers at no cost.
Cloud hosting: Starting at €22 per month, this plan includes automatic updates, backups, and customer support.
Reviews
Sr.
What people like about it
What people dislike about it
1
Like: Full data ownership and privacy compliance.
Dislike: Initial setup can be complex.
2
Like: Comprehensive e-commerce tracking.<br>- Visual tools like heatmaps and session
Dislike: Requires technical knowledge to fully utilize features.
3
Like: Extensive integration options.
Dislike: User interface is less intuitive compared to competitors.
4. PiwikPro
Piwik PRO is a comprehensive web analytics tool tailored for enterprises that prioritize data privacy and regulatory compliance. Offering powerful analytics capabilities, Piwik PRO enables organizations to track user behavior while ensuring strict adherence to privacy laws such as GDPR and HIPAA.
Key features of PiwikPro
Data privacy compliance: PiwikPro is known for its strong focus on data privacy, ensuring compliance with GDPR, HIPAA, and other regulations.
User-friendly interface: Offers a clean and intuitive interface, making it easy for users to navigate and extract insights.
Customizable reports: Provides extensive customization options for reports, enabling users to tailor the data to their specific needs.
Comprehensive analytics: Includes features such as session recording, heatmaps, and funnel analytics to provide a deep understanding of user behavior.
Data ownership: Users have complete ownership and control over their data, with options for on-premises or cloud hosting.
Seamless integrations: Easily integrates with various third-party tools and platforms, enhancing its functionality.
Tag management system: Includes a high-powered tag management system for efficient data collection and tracking.
Support and training: Offers excellent customer support and training resources to help users maximize the platform’s potential.
PiwikPro offers a range of pricing plans tailored to different business needs. However, detailed pricing information is generally provided upon request. Commonly, they offer:
Core Plan: Free plan suitable for small websites with limited features.
Enterprise Plan: Comprehensive plan for large enterprises, with full access to all features and dedicated support. Pricing starts from €10,995 /year.
Reviews
Sr.
What people like about it
What people dislike about it
1
Like: Users appreciate the strong focus on data privacy and compliance with regulations like GDPR.
Dislike: Some users find the initial setup process to be complex and time-consuming.
2
Like: The customizable reports and extensive analytics capabilities are highly valued.
Dislike: Pricing is really high as compared to other options.
3
Like: Excellent customer support and comprehensive training resources receive positive feedback.
Dislike: The user interface, while functional, can be seen as less modern compared to competitors.
A complete link management solution
for marketing professionals & agencies.
Try Replug for free
5. Plausible
Plausible is a lightweight and privacy-focused web analytics tool designed to provide essential insights without compromising user privacy. It offers a simple and intuitive interface, delivering key metrics and real-time data to help website owners understand their audience and optimize their online presence.
Key features of Plausible
Privacy-focused analytics: Plausible emphasizes user privacy, offering analytics without the use of cookies and ensuring compliance with privacy regulations.
Simplified dashboard: Provides a clean and easy-to-use dashboard with essential metrics like visitors, page views, and bounce rates.
Real-time analytics: Offers real-time data updates, allowing users to monitor website performance instantly.
Customizable reports: Allows users to create custom reports and filter data based on various parameters.
Performance metrics: Provides insights into site speed, device types, and traffic sources to optimize performance.
Integration capabilities: Integrates seamlessly with popular platforms like WordPress, Shopify, and more.
Open source: Being open-source, Plausible offers transparency and allows for community contributions and customization.
Pricing plans of Plausible
Plausible offers transparent pricing plans based on the number of page views per month. As of the latest updates:
Growth: Starts from $9/month.
Business: Starts from $19/month.
Enterprise: Offers custom pricing.
Reviews
Sr.
What people like about it
What people dislike about it
1
Like: Users appreciate the simplicity and clarity of the dashboard.
Dislike: Some users find the customization options for reports and analytics to be somewhat limited compared to more complex tools.
2
Like: The focus on privacy and the ability to track goals and conversions without invasive tracking methods receive positive feedback.
Dislike: Users have reported occasional issues with integration and data accuracy, especially with certain CMS platforms.
3
Like: The open-source nature of Plausible is highly valued for its transparency and community-driven development.
Dislike: Pricing can become expensive as website traffic grows, which may not be cost-effective for very high-traffic sites.
6. Simple Analytics
Simple Analytics is a privacy-friendly web analytics tool that delivers essential website metrics without tracking personal data. An easy-to-use interface provides clear insights to help website owners make informed decisions while ensuring compliance with privacy regulations.
Key features of Simple Analytics
Privacy-focused analytics: Similar to Plausible, Simple Analytics emphasizes privacy by providing analytics without the use of cookies or tracking personal data.
Real-time dashboard: Offers a real-time dashboard that updates instantly, displaying essential metrics like visitors, page views, and referrers.
No ads or tracking: Ensures that the analytics tool itself does not track users or display ads, focusing solely on providing accurate data insights.
Goal tracking: Allows users to set and track goals, such as conversions or specific user actions, to measure website performance effectively.
Customizable reports: Offers customizable reports and filtering options to analyze data based on different parameters and time frames.
Integration capabilities: Integrates smoothly with various platforms and CMSs, simplifying setup and data collection processes.
Pricing plans of Simple Analytics
Simple Analytics offers straightforward pricing based on the number of page views per month:
Free: Ideal for personal websites or blogs.
Personal: Starts from $10/month.
Team: Starts from $40/month.
Enterprise: Contact sales.
Reviews
Sr.
What people like about it
What people dislike about it
1
Like: Users appreciate the simplicity and ease of use, especially the real-time dashboard and privacy-focused approach.
Dislike: Some users find the reporting capabilities to be basic compared to more feature-rich analytics tools.
2
Like: The commitment to privacy and no ads/tracking policy receives positive feedback.
Dislike: Integration with some specific platforms or custom setups may require additional configuration or support.
3
Like: Customer support is praised for being responsive and helpful.
Dislike: Pricing might be seen as slightly higher compared to competitors offering similar features.
7. Clicky
Clicky is a real-time web analytics tool that offers detailed insights into website traffic and user behavior. With features like heatmaps, uptime monitoring, and customizable dashboards, Clicky provides comprehensive data to help website owners optimize their online performance and user engagement.
Key features of Clicky
Real-time analytics: Provides real-time data updates, allowing users to monitor website traffic and activity instantly.
Detailed visitor information: Offers detailed insights into visitor behavior, including heatmaps, session details, and individual visitor tracking.
Goals and conversion tracking: Allows users to set goals and track conversions, providing insights into website performance and marketing campaigns.
Customizable dashboards: Provides customizable dashboards and reports to tailor analytics data according to user preferences.
Heatmaps: Offers heatmaps to visualize user interaction and engagement on web pages.
Uptime monitoring: Provides uptime monitoring to alert users of website downtime or performance issues.
API access: Offers API access for integration with other applications and services.
Pricing Plans of Clicky
Clicky offers pricing plans based on the number of websites and page views tracked:
Free Plan: Includes basic features with limited data retention and website tracking.
Pro Plan: Starts from $9.99/month.
Pro Plus: Starts from $14.99/month.
Pro Platinum: $19.99/month.
Custom: varied pricing.
Reviews
Sr.
What people like about it
What people dislike about it
1
Like: Users like the real-time analytics and detailed visitor information, including heatmaps and individual visitor tracking.
Dislike: Some users find the user interface to be less intuitive compared to other analytics tools.
2
Like: The goals and conversion tracking features receive positive feedback for their effectiveness in monitoring website performance.
Dislike: Pricing for higher traffic volumes may be perceived as expensive compared to competitors offering similar features.
3
Like: The “Spy” feature is praised for its real-time tracking capabilities and detailed insights into user behavior.
Dislike: Customer support responsiveness can vary, with occasional delays in resolving technical issues reported by some users.
8. Fathom Analytics
Fathom Analytics is a privacy-focused web analytics tool that provides straightforward and actionable insights without tracking personal data. It offers a clean, user-friendly interface, enabling website owners to understand their audience and improve their online presence while respecting user privacy.
Key features of Fathom Analytics
Privacy-focused analytics: Fathom Analytics prioritizes user privacy by offering analytics that is GDPR, CCPA, and PECR compliant without the use of cookies.
Real-time analytics: Provides real-time data updates and insights into website traffic and visitor behavior.
Simple dashboard: Offers a clean and intuitive dashboard for easy navigation and understanding of analytics data.
Goal tracking: Allows users to set goals and track conversions to measure the effectiveness of marketing campaigns and website performance.Incorporating free time tracking software can help you monitor the time spent on each campaign phase, ensuring that your efforts are both efficient and well-documented.
Website performance monitoring: Provides insights into website performance metrics such as page load times and bounce rates.
Customizable reports: Offers customizable reports and data filters to analyze website traffic based on various parameters.
Integration capabilities: Integrates with various platforms and content management systems (CMS) for seamless setup and data collection.
No ads or tracking: Ensures that the analytics tool itself does not track users or display ads, focusing solely on providing accurate and privacy-conscious data.
Pricing plans of Fathom Analytics
Fathom Analytics offers straightforward pricing plans based on the number of websites and page views tracked:
Up to 100,000 data points: $15 per month
Up to 1,000,000 data points: $60 per month
Up to 25,000,000 data points: $470 per month
Over 25,000,000 data points: Contact Fathom Analytics for a quote
Reviews
Sr.
What people like about it
What people dislike about it
1
Like: Users appreciate the privacy-focused approach and compliance with data protection regulations like GDPR.
Dislike: Some users find the feature set to be limited compared to more comprehensive analytics tools.
2
Like: The simplicity and ease of use of the dashboard receive positive feedback for making analytics accessible to all users.
Dislike: Pricing may be considered higher compared to other similar privacy-focused analytics solutions.
3
Like: The real-time analytics and customizable reports are praised for providing valuable insights into website performance.
Dislike: Integration with certain platforms or custom setups may require additional configuration or support.
Maximize marketing ROI
by transforming ordinary URLs into branded short links that convert.
Try Replug for free
9. Chartbeat
Chartbeat is a real-time web analytics tool tailored for content creators and publishers, offering in-depth insights into audience engagement and content performance. With features like real-time dashboards, headline testing, and in-depth reporting, Chartbeat helps optimize content strategy and maximize reader engagement.
Key features of Chartbeat
Real-time analytics: Provides real-time data updates on website traffic, engagement metrics, and content performance.
Audience insights: Offers detailed audience segmentation and insights to understand visitor behavior and demographics.
Content optimization: Helps optimize content strategy with insights into popular content, engagement levels, and reader retention.
Engagement metrics: Measures user engagement metrics such as scroll depth, time on page, and social sharing.
Traffic sources: Tracks and analyzes traffic sources to identify where visitors are coming from and their behavior patterns.
Video analytics: Provides analytics for video content, including views, completion rates, and engagement metrics.
Mobile analytics: Offers mobile-specific analytics to monitor and optimize performance across mobile devices.
Integration capabilities: Integrates with various CMS platforms, advertising networks, and marketing tools for comprehensive data collection and analysis.
You may also like: How to Build Custom Audiences through Replug URL Tracking
Pricing plans of Chartbeat
Chartbeat typically offers customized pricing plans based on specific business needs, website traffic, and additional features required. Detailed pricing information is usually provided upon request or through direct consultation with their sales team.
Reviews
Sr.
What people like about It
What people dislike about it
1
Like: Users appreciate the detailed real-time analytics and audience insights that help them understand visitor behavior.
Dislike: Some users find the interface to be complex and overwhelming, especially for new users.
2
Like: The content optimization tools and engagement metrics receive positive feedback for improving content strategy and performance.
Dislike: Pricing may be considered high, especially for smaller businesses or websites with lower traffic volumes.
3
Like: The integration capabilities and support for various platforms are praised for enhancing functionality and data collection.
Dislike: Customer support responsiveness can vary, with occasional delays reported when resolving technical issues.
10. Tiny Analytics
Next on our best web analytics tools list is Tiny Analytics. It is a minimalist web analytics tool that focuses on delivering essential insights without overwhelming complexity. Designed for simplicity and ease of use, it provides key metrics to help website owners understand their audience and improve their online performance.
Key features of Tiny Analytics
Simple and lightweight: Tiny Analytics focuses on simplicity and minimalism, providing essential analytics metrics without unnecessary complexity.
Real-time data updates: Offers real-time updates on website traffic, visitor behavior, and engagement metrics.
User-friendly interface: Provides a clean and intuitive interface for easy navigation and data visualization.
Privacy-conscious: Ensures user privacy with minimal data collection and no use of cookies or tracking mechanisms.
Customizable dashboards: Allows users to customize dashboards and reports according to their specific needs and preferences.
Goal tracking: Includes goal tracking features to monitor and measure conversions or specific actions on websites.
Mobile-friendly: Optimized for mobile devices, providing analytics on mobile traffic and performance.
Integration capabilities: Integrates smoothly with various platforms and content management systems (CMS) for seamless setup and data integration.
Pricing plan of Tiny Analytics
Free plan: $0/month.
Basic plan: Starts from $49/month.
Advanced: $129/month.
Reviews
Sr.
What people like about it
What people dislike about it
1
Like: Users like the simplicity and lightweight nature of Tiny Analytics, making it easy to use and understand analytics data.
Dislike: Some users may find the feature set limited compared to more comprehensive analytics tools.
2
Like: The real-time data updates and user-friendly interface receive positive feedback for providing instant insights and ease of use.
Dislike: Customization options for reports and dashboards may be perceived as limited for advanced users or specific needs.
11. Statcounter
Statcounter is a comprehensive web analytics tool that provides detailed statistics on website traffic and visitor behavior. With features like real-time data tracking, customizable reports, and user-friendly dashboards, StatCounter helps website owners and marketers optimize their online presence and improve user engagement.
Visitor behavior: Tracks visitor behavior such as entry pages, exit pages, bounce rates, and session durations.
Keyword analysis: Offers keyword analysis to understand how visitors find the website through search engines.
Customizable alerts: Allows users to set up customizable alerts for traffic spikes, visitor trends, or specific events.
User-friendly interface: Provides a straightforward and easy-to-use interface for navigating analytics data.
Geolocation tracking: Provides geolocation tracking to see where visitors are located globally.
Mobile analytics: Offers analytics for mobile website traffic and performance.
Customizable reports: Allows users to create customized reports and export data for further analysis.
Pricing plan of Stat Counter
Stat Counter offers various pricing plans tailored to different needs:
Basic plan: It is free of cost.
Premium plan: €16/month.
Premium plus: €28/month.
Reviews
Sr.
What people like about it
What people dislike about it
1
Like: Users appreciate the detailed website traffic analysis and visitor behavior tracking features.
Dislike: Some users find the interface outdated compared to more modern analytics tools.
2
Like: The customizable alerts and geolocation tracking receive positive feedback for providing actionable insights.
Dislike: Customer support response times can vary, with occasional delays reported when resolving issues.
12. Open Web Analytics
Open Web Analytics (OWA) is an open-source web analytics software that offers extensive tracking and reporting capabilities. It allows website owners to monitor visitor behavior, track conversions, and analyze traffic sources using customizable dashboards and reports. OWA provides flexibility and control over data, making it a suitable choice for businesses seeking a customizable analytics solution.
Key features of Open Web Analytics
Open source: Open Web Analytics is an open-source web analytics platform that allows for transparency, customization, and community contributions.
Real-time analytics: Provides real-time data updates on website traffic, visitor behavior, and engagement metrics.
Customizable dashboards: Offers customizable dashboards and reports to tailor analytics data according to user preferences.
Goal tracking: Allows users to set goals and track conversions to measure the effectiveness of marketing campaigns and website performance.
Event tracking: Provides event tracking capabilities to monitor specific user interactions and actions on websites.
User-friendly interface: Offers a user-friendly interface for easy navigation and data visualization.
Integration capabilities: Integrates with various platforms and content management systems (CMS) for seamless setup and data integration.
Privacy-conscious: Ensures user privacy by allowing users to host their analytics data and control data collection practices.
Pricing plan of Open Web Analytics
Open Web Analytics is typically free to use as it is open-source software. Users can download and install it on their own servers or hosting environments without cost.
Reviews
Sr.
What people like about it
What people dislike about it
1
Like: Users appreciate that Open Web Analytics is open-source, providing transparency, customization options, and community support.
Dislike: Setting up and configuring Open Web Analytics may require technical expertise and effort.
2
Like: The real-time analytics capabilities and customizable dashboards receive positive feedback for their usefulness in monitoring website performance.
Dislike: Documentation and support resources may be limited compared to commercial analytics solutions, requiring self-help or community assistance.
Looking for something more? Try out Replug, all in one tool for digital marketing and web analytics. The easiest way to track, manage and retarget website visitors. Get started for free!
Why choose Usermaven over other website analytics tools
What if there was a solution that prioritized both user privacy and actionable insights, delivered with a user-friendly interface?
Look no further than Usermaven. Here’s how Usermaven stands out from the crowd:
Privacy champion:
User trust matters: Unlike GA4, Clicky, and many others, Usermaven is 100% GDPR and CCPA-compliant. We prioritize user privacy, never tracking personal data or selling your information.
Peace of mind: Focus on your website, not privacy regulations. Usermaven simplifies compliance compared to the complexities of self-hosting solutions like Open Web Analytics.
Effortless setup:
No coding required: Get started in minutes with our intuitive interface. Leave the coding headaches behind with Piwik Pro’s steeper learning curve.
Fast implementation: Unlike tools with delayed onboarding processes (Matomo), Usermaven empowers you to unlock insights quickly.
Actionable insights in real-time:
See it now act now: Witness user behavior unfold before your eyes. Usermaven provides real-time data, unlike delayed reporting in Stat Counter and Simple Analytics.
Go beyond the surface: Ditch vanity metrics. Usermaven dives deep, revealing user journeys, conversion funnels, and engagement patterns, offering more value than basic tools like Plausible and Tiny Analytics.
Cost-effective champion:
Value without the burden: Unlock powerful insights for less. Usermaven offers a free trial and flexible pricing plans, making it accessible to all businesses. This is a stark contrast to often-expensive solutions like Chartbeat and Fathom Analytics.
User reviews:
Hear from satisfied users: Usermaven boasts positive reviews praising its user-friendliness and privacy focus.
A complete link management solution
for marketing professionals & agencies.
Try Replug for free
Final verdict: The best web analytics tool
After carefully considering its distinctive features, stellar ratings, and competitive pricing, Usermaven emerges as the top choice for businesses seeking a web analytics tool that balances power with affordability.
Usermavenempowers you to understand, optimize, and convert your website visitors with unparalleled ease and complete user privacy. It’s the perfect solution for businesses and agencies seeking a powerful yet approachable website analytics tool.
Website analytics tools track and analyze user behavior on websites, providing insights into visitor interactions, traffic sources, and more.
How do I choose a web analytics tool?
Choose a web analytics tool based on your specific needs, such as features like real-time data, user privacy options, ease of use, and pricing that fits your budget.
What web analytics tool is better than Google Analytics?
Usermaven surpasses Google Analytics with its advanced features, intuitive interface, and stringent privacy controls, making it the superior choice for businesses seeking a comprehensive web analytics tool.
What good is all the effort you put into creating engaging content and driving traffic to your website if it doesn’t result in meaningful actions?
Therefore, having a powerful tool at your disposal can help you not only boost your conversion rates but also understand exactly how and why your audience is taking action.
And if you’re not using those advanced conversion tracking tools or not following the smart tips you’re probably missing out on a lot of revenue.
That’s why we are here with a quick guide just for you guys. So you can get your hands on some of the top-notch conversion tracking tools, tips, and much more…
Linkly simplifies link tracking, allowing users to monitor click activity on specific links. Utilize your own domain to generate custom branded short-links and promote your business with every click, making it an ideal tool for conversion tracking and marketing.
Sniply is a powerful marketing tool that allows users to add custom CTAs to any link they share. With Sniply, you can drive traffic back to your own website or landing pages.
Best for detailed link analytics and capture UTM parameters, setting up conversion goals, analyzing user journeys, UTM attributions etc. It gives you 100% data ownership, ensuring full control over your analytics data.
Mixpanel provides powerful conversion tracking tools for businesses, enabling better decision-making and growth monitoring. With Mixpanel, you can track user engagement and compare current trends to past performance, helping you optimize conversions and drive business success.
Kissmetrics provides powerful conversion tracking tools for businesses. With its advanced analytics platform, businesses can track customer behavior across their websites and campaigns, allowing for targeted optimization and increased conversions.
Sprinklr offers advanced conversion tracking featuires to optimize your social media presence. Monitor and enhance performance across platforms for improved engagement and increased conversions.
Conversion tracking is the process of monitoring specific actions users take on your website, app, or elsewhere, signifying that they’ve interacted with your brand in a way that’s valuable to your business.
But conversions go beyond just sales. They bring in a variety of valuable actions, such as:
Form submissions (e.g., contact forms, download requests)
App downloads (if you have an app)
And much more…
Importance of conversion tracking
By tracking conversions, you gain valuable insights into how well your marketing campaigns are performing and where you can optimize for better results.
Today, conversion tracking is not just a luxury but a necessity for any business looking to thrive in the competitive online landscape.
According to a study, conversion rate is the 4th most important metric for marketers. These numbers highlight the pivotal role that conversion tracking plays in modern marketing strategies. It’s not just about tracking sales; it’s about understanding customer behavior, optimizing campaigns, and maximizing ROI.
What are the benefits of conversion tracking?
When you start keeping track of your conversions, you open up a world of benefits. Here are some of the best ones:
Improved return on investment (ROI) – By understanding what’s working and what’s not, you can allocate your resources more effectively and maximize your return on investment (ROI).
Making smarter choices with data – Conversion tracking provides you with valuable data that you can use to make data-driven decisions about your marketing strategy. This data can help you identify trends, understand your target audience better, and create more effective marketing campaigns.
Fine-tuning your website and landing pages – Identify areas on your website or landing pages that are hindering conversions.
List out top content – You can use conversion tracking data to see which pieces of content are most effective at driving conversions. This information can be used to create more content that is likely to convert visitors into leads or customers.
Seeing which campaigns do the most – See which campaigns (paid ads, social media posts, email marketing) are driving the most conversions, allowing you to focus your budget and efforts on the most successful ones.
Gain customer insights – Conversion tracking data can reveal valuable insights into your customer behavior, helping you tailor your marketing messages and offerings to better meet their needs.
Smarter budget allocation – With conversion data in hand, you can allocate your marketing budget more effectively. You can invest more in the channels that are driving the most conversions and less in the channels that are not performing well.
Best conversion tracking tools
1. Replug
A complete link management solution
for marketing professionals & agencies.
Try Replug for free
Replug is a complete link management platform that allows brands to track a multitude of URL parameters such as clicks, conversions, and unique visitors to make informed decisions on doubling down on profitable streams.
With this conversion rate optimization tool, you can set goals for your campaigns to track and analyze how many conversions you have achieved for certain campaigns. Examine traffic parameters such as device type, browser, country, and IP to create targeted campaigns.
In easier words, Replug’s click analytics help you track where users click on your website or within links you’ve shortened. This provides insights into user behavior, such as which buttons or CTAs (calls to action) are most effective and where users navigate after clicking a link.
Linkly is another link management tool for marketers, as the platform provides shortened and branded links. With features like A/B testing and retargeting, it also helps one to optimize link performance. Besides that Linkly does help in conversion tracking. It provides insights into how many clicks on your links lead to desired actions, such as purchases or sign-ups. Depending on your needs, Linkly’s pricing might not be the most competitive. It’s always best to compare pricing plans of different tools before making a decision.
Sniply stands out for its unparalleled ability to track and analyze user behavior, empowering marketers to refine their content curation strategies based on genuine audience engagement.
While monitoring click-through rates on your call-to-action (CTA) provides valuable insights into the effectiveness of your content curation efforts, Sniply goes further.
It’s essential to recognize that while Sniply offers robust analytics features, its primary function remains centered around content marketing and enhancing engagement through strategically placed CTAs.
An affordable yet advanced alternative to Google Analytics. It automatically captures most user actions on your website or app without any developer dependency.
Some of the key metrics you will see on the web analytics dashboard include total visitors, page views, covered events, bounce rate, scroll depth, time spent on the page, top traffic channels/sources, devices, locations, and top-performing keywords, etc.
Besides that with the multi-touch attribution feature, one can even capture UTM parameters (tags used to track campaign performance) and backfill data even if a user signs up later.
Or segment users based on various criteria like demographics or behavior. This lets you analyze conversion rates for specific user groups. You can also visualize conversion funnels to pinpoint drop-off points where users abandon the conversion process.
Now let’s get back to our traditional analytics tools. Just like Usermaven, this powerful analytics platform allows you to track user behavior across platforms and devices.
Mixpanel excels at creating custom funnels and reports, enabling you to analyze the entire conversion journey and identify bottlenecks. By understanding user behavior, you can identify areas for improvement and optimize your product or website to drive engagement and conversions. Other than that the platform offers clear visualizations and insightful reports, which allows you to make data-driven decisions to achieve your marketing goals.
However, keep in mind that setting up and configuring Mixpanel can require some technical knowledge, especially for complex tracking needs.
Another user behavior analytics platform with a focus on customer journey analysis, Kissmetrics helps you understand the “why” behind user actions. By analyzing user behavior patterns, you can identify drop-off points to personalize the experience and improve conversion rates.
However, there are some drawbacks to using kissmetrics as well. Take for example the platform lacks a free tier and has a starting price point that might be steep for small businesses or startups.
Besides that when compared to some competitors, the conversion tracking platform platform might have fewer out-of-the-box integrations with other platforms. This might require additional development work for certain setups.
Matomo prioritizes privacy and data ownership. Unlike some analytics tools, it keeps your website visitor data on your own server, giving you complete control. You can customize what data is collected and avoid relying on third-party servers.
However, this self-hosted approach requires some technical setup compared to hosted solutions. Additionally, the user interface might feel less intuitive for beginners, and some advanced features require paid plans. Despite these drawbacks, Matomo’s focus on privacy and data security makes it a strong choice for businesses prioritizing user data control.
ContentStudio helps you manage your social media campaigns all in one place. This lets you see how different pieces of content are performing within a campaign, which can help you identify what types of content are most effective at bringing in conversions.
Overall, this all-in-one content marketing platform offers built-in conversion tracking functionalities. For example, you might create a campaign to promote a new product launch. By tracking the performance of different social media posts within that campaign in CS you can see which posts are generating the most interest and conversions.
Sprinklr is a comprehensive social media management platform used by businesses worldwide. It offers tools for scheduling posts, engaging with audiences, and analyzing performance across various social media channels. Its advanced analytics provide valuable insights into audience behavior and campaign effectiveness, conversion tracking helping brands make data-driven decisions.
Kindly choose a slot that suits your schedule from the available options below.
Top tips for effective conversion tracking
A complete link management solution
for marketing professionals & agencies.
Try Replug for free
Define clear conversion goals: What actions do you want users to take on your website or app? Be specific and measurable.
Set up conversion tracking correctly: Ensure your tracking code is implemented accurately to capture all conversion data.
Track multiple conversion points: Don’t just focus on sales; track other valuable actions like sign-ups, downloads, or video views.
Segment your data: Analyze your conversion data by different segments (e.g., traffic source, device type) to gain deeper insights.
Regularly review and optimize: Monitor your conversion data and make adjustments to your marketing campaigns and website based on your findings.
As we wrap up, it’s clear that conversion tracking isn’t just a trend—it’s a necessity for businesses aiming to thrive in the digital age. By utilizing the right tools and following smart tips, businesses can gain valuable insights, optimize their marketing efforts, and ultimately drive more revenue.
FAQs about conversion tracking
Why do I need conversion tracking?
Conversion tracking shows how well your marketing efforts drive sales or desired actions (sign-ups, downloads). Optimize campaigns to get more results for your investment.
How do you track customer conversion?
Use website tags, and UTM codes, or track specific actions like purchases or form submissions to see how customers convert.
What is the goal of conversion tracking?
To understand which channels (social media, email) bring in the most valuable customers by tracking conversions.
What is conversion rate tracking?
Conversion rate tracking calculates the percentage of visitors who take a desired action (e.g., buy something).
What is conversion tracking protocol?
Conversion tracking protocols ensure consistent and accurate data collection across different platforms.
How do you keep track of the conversion rate?
Divide the number of conversions by total visitors and multiply by 100% to find your conversion rate.
What is the recommended way to track conversions?
Use conversion tracking tools like Replug for simplified setup, tracking, and analysis of your conversion data.
What is the difference between a micro conversion and a macro conversion?
Micro: Smaller actions like adding items to a cart.
Macro: Bigger goals like completing a purchase or signing up for a service.
Are tracking pixels illegal?
Tracking pixels is not illegal, but respecting user privacy and getting consent for data collection is crucial.
Who uses pixel tracking?
Marketers or product owners use pixel tracking to understand ad performance and website visitor behavior.
What is the difference between tracking pixels and cookies?
Pixel: Tiny image that sends data when loaded, works even with cookie blocking.
Cookie: Small data file stored on the user’s device, privacy concerns exist.
Clicks are valuable, but only if you understand what happens after. It’s time to stop being in the dark and turn those clicks into conversions.
Don’t know how? No worries! Our blog explains the importance of click analytics and how to track your clicks using top link management tools. Gain insights into user behavior and boost conversions effortlessly. Keep reading…
What is click analytics?
Click analytics refers to the process of monitoring and analyzing user clicks on various elements of a website. These elements could include links, buttons, images, or any interactive component users can engage with.
By tracking these clicks, businesses can gain valuable insights into user behavior, such as which pages are most visited, which links are clicked the most, and how users navigate through the website.
A complete link management solution
for marketing professionals & agencies.
Try Replug for free
Why use click tracking?
There are tons of reasons why every brand should utilize proper click tracking. Some of the major benefits include the following.
Personalize the user journey
Stop blaming the algorithm. Personalize your customer’s experience by utilizing click analytics.
Tailor your messaging and offers to individual users based on their past clicks and behavior.
Identify high-value clicks
Not all clicks are created equal. Click analytics can help you identify which clicks are most likely to convert into paying customers. This allows you to focus your marketing efforts on the most valuable segments of your audience.
Measure the ROI of your campaigns
Are your marketing campaigns delivering a positive return on investment (ROI)?
Replug-click analytics provides the data you need to measure the effectiveness of your campaigns and make adjustments as needed.
Make data-driven decisions
By analyzing click data, businesses can make informed decisions about their marketing strategies, content optimization, and website design. Understanding which links or calls to actions are most effective allows businesses to allocate resources more efficiently and prioritize initiatives that drive results.
By pinpointing areas where users are dropping off or abandoning the conversion process, businesses can implement targeted strategies to streamline the funnel and increase conversion rates.
Optimize landing pages
Are your landing pages aligned with user expectations?
Replug-click analytics can help you identify areas for improvement on your landing pages. By understanding how users interact with your pages, you can make data-driven changes to improve conversion rates.
The best tool for click analytics: Replug
A plethora of click-tracking or link-tracking tools are available in the market, each with its own set of features and pricing plans. Among the notable players in this space are Replug, PrettyLinks, and many more.
While each of these tools serves the fundamental purpose of tracking clicks and analyzing user behavior, they vary in terms of their capabilities, user interface, and pricing structures.
We would suggest you forget confusing tools, go for Replug as it’s the most simple and powerful.
Replug stands out from other tools by offering an extensive range of advanced features tailored to suit brands of all sizes and industries.
Besides that
Replug offers a free plan to get you started.
Replug integrates with various marketing tools and platforms for a smooth workflow.
Replug: The all-in-one solution
Replug serves as the all-in-one click-tracking solution for marketers. Utilize its link-tracking tool to analyze various key performance indicators (KPIs). Easily set expiry dates for time-sensitive promotions and add passwords for added security, ensuring only authorized users can access your links.
Additionally, Replug allows you to personalize and organize your trackable links effortlessly using tags. This simplifies the management process, making it easier to navigate through your campaigns and track performance effectively. And that’s just scratching the surface of what Replug can do.
Key features of Replug click analytics
Here’s a quick overview of some of the important metrics Replug provides:
Total clicks
Total number of times your link has been clicked.
Unique clicks
The number of individual users who clicked your link.
Conversions
The number of times a desired action was taken (e.g., purchase, signup).
Conversion rate
The percentage of clicks that resulted in a conversion.
Click source
Where the click originated from (e.g., email, social media, website).
Replug’s data can help you identify areas for improvement on your landing pages, personalize your marketing messages, and ultimately turn more clicks into conversions.
1. Click tracking and attribution
Replug tracks where users go after clicking your link.
Did they find the right page? Did they convert?
By accurately attributing clicks to specific marketing initiatives or campaigns, businesses can refine their strategies and allocate resources more efficiently.
2. Conversion rate optimization (CRO)
One of the standout features of Replug click analytics is its focus on conversion rate optimization. By analyzing user behavior and identifying bottlenecks in the conversion funnel, Replug enables businesses to implement targeted strategies to enhance conversion rates and maximize ROI.
3. Real-time data and insights
With Replug click analytics, businesses gain access to real-time data and insights, allowing them to make informed decisions on the fly. Whether it’s tracking the performance of a new marketing campaign or identifying emerging trends in user behavior, Replug equips businesses with the tools they need to stay ahead of the curve.
4. Customizable reports and dashboards
Replug offers customizable reports and dashboards that cater to the unique needs of each business. From high-level overviews to granular insights, businesses can tailor their reporting dashboards to focus on the metrics that matter most to them, facilitating data-driven decision-making at every level.
A complete link management solution
for marketing professionals & agencies.
Try Replug for free
How to track clicks and conversions using Replug?
Step 1: Create a Replug account (or sign in):
Sign up for a free account (or log in if you already have one).
Step 2: Choose or create a campaign
From the main dashboard, you can either select an existing campaign or create a new one. Campaigns are used to organize and group your tracking URLs.
Step 3: Enter the destination URL
Enter the destination URL that you want to track in the “URL to shorten” section, located below the “Select your campaign” option.
Step 4: Add UTM parameters
On the right side of the “URL to shorten” section, locate the “add UTM” tag and click on it.
Step 5: Select or create UTM parameters
You have the option to either select from saved UTM parameters or create a new set.
If you’re creating a new one, fill in the UTM parameters, including source, medium, campaign name, and other necessary details.
Step 6: Generate the tracking URL
After adding or selecting the UTM parameters, click the “Create” button. Replug will automatically generate a shortened version of your URL with the appended UTM parameters.
Step 7: Customize the tracking URL (optional)
If desired, you can further customize the URL by clicking the edit icon.
Step 8: Copy and update
Copy the generated tracking URL to use in your marketing materials.
Click the “Update” button to save your changes.
Step 9: Access your tracking URL
To access the newly created tracking URL and monitor its performance, follow these steps:
Go to the main dashboard.
Click on “Manage.”
Select “Replug links.”
And you’re good to go with your trackable links.
Replug Link management solutions
Replug goes beyond just click analytics and acts as a complete link management solution as well. Here’s how:
White label for agencies and resellers: Agencies and resellers can leverage Replug’s white-label functionality. Replug can be branded with your own logo and domain, allowing you to offer click analytics and link management as part of your client services.
Built-in CTA generator: Craft high-performing CTAs directly within Replug. No need for separate tools! Replug suggests clear and actionable CTAs based on your link’s purpose (e.g., “Shop Now,” “Download Here,” “Learn More”).
Link rotator for A/B testing: Want to test different landing pages or offers? Replug’s link rotator automatically distributes clicks among various options. Analyze which one performs best and optimize your campaigns for maximum conversions.
Shortened branded links: Replug allows you to shorten long URLs and brand them with your custom domain. This makes your links look professional and memorable.
Bio-link creation: Replug lets you create bio links, a single landing page containing multiple links to your social media profiles, portfolio, or other relevant content. This is perfect for social media bios where you have limited space.
Retargeting pixels: Replug integrates with retargeting pixels from social media platforms like Facebook and LinkedIn. This allows you to retarget users who clicked your links with relevant ads, increasing the chance of conversions.
All in all, note that click analytics lets you focus your marketing efforts on the right audience, maximizing your return on investment and avoiding wasting your budget on clicks that go nowhere.
That was all in today’s blog. Thank you so much for staying with us till the very end! Visit our website for more information.
FAQs
What’s the difference between conversions and clicks?
Clicks are simply when someone clicks on your link or ad. Conversions are when someone takes a desired action, like buying a product or signing up for a newsletter.
What is a CTR?
CTR stands for Click-Through Rate, a metric showing the percentage of people who see your ad or link and click on it.
How to increase my click-through rate?
Tips to increase CTR:
Use compelling ad copy.
Optimize ad placement.
Utilize relevant keywords.
Test different ad formats.
What is a good CTR?
A “good” CTR depends on your industry and campaign goals. Generally, anything above 1% is considered decent, but some niches can see higher CTRs.
In the world of digital marketing, “unique clicks” are a big deal. They give us a clearer picture of how people engage with online content. Unlike total clicks, which count every time someone clicks on a link, unique clicks only count each person once, no matter how many times they click.
But how do we track and make sense of these unique clicks? That’s what we’ll uncover in this guide. We’ll cut through the terminology and get straight to the heart of unique clicks, why they matter, and how to track them effectively. So, let’s dive in and explore the world of unique clicks together.
What are unique clicks?
Unique clicks refer to the number of individual users who have clicked on a particular link or piece of content within a specified time frame. Unlike total clicks, which count every click regardless of whether it comes from the same user multiple times, unique clicks only count each user once.
This distinction is crucial for understanding the actual engagement level of a campaign or piece of content, as it provides insight into the number of distinct individuals who have interacted with it.
Unique clicks help marketers measure the effectiveness of their digital strategies and gauge audience interest and responsiveness.
Unique clicks vs total clicks: What’s the difference?
The main difference between unique clicks and total clicks lies in how they measure user engagement with digital content:
Unique clicks:
Unique clicks represent the number of distinct individuals who have clicked on a particular link or piece of content within a specified time frame. Each user is counted only once, regardless of how many times they click on the link. Unique clicks provide insights into the number of different individuals engaging with the content.
Total clicks:
Total clicks, on the other hand, count every instance of a user clicking on the link or content, including multiple clicks from the same individual. This metric measures the overall volume of clicks generated by a campaign or piece of content, regardless of whether they come from the same user.
How to calculate unique clicks?
Determine unique clicks: Use a web analytics tool or Replug to find the total number of unique clicks generated by your campaign.
Find total recipients or impressions: Identify the total number of email recipients or ad impressions for your campaign.
Apply the formula: Use the formula below to calculate the unique click rate:
Unique click rate=(Total Number of Email Recipients or Ad Impressions / Total Number of Unique Clicks) × 100
Example calculation: For instance, if your campaign records 500 unique clicks from 10,000 email recipients:
Unique Click Rate = (500 / 10,000) × 100 = 5%
Interpretation: A unique click rate of 5% indicates that 5% of recipients or impressions clicked on your campaign’s links, offering valuable insights into engagement levels and potential ROI.
A complete link management solution
for marketing professionals & agencies.
Try Replug for free
Create a Replug account: Sign up for a Replug account if you haven’t already. You can do this by visiting the Replug website and following the registration process.
2. Generate tracked links: Once logged in, create trackable links within the Replug app. You can do this by entering the original URL you want to track and customizing the link settings to your preferences.
3.Utilize Replug’s tracking parameters: Replug automatically generates unique tracking parameters for each link you create. These parameters enable Replug to track clicks and attribute them to specific campaigns or sources.
4.Share tracked links: Use the generated tracked links in your marketing campaigns, social media posts, emails, or any other channels where you want to track user clicks.
5.Access Replug analytics: Navigate to the analytics dashboard in Replug. Here, you can view detailed insights into click data, including the number of unique clicks generated by each tracked link.
6.Review unique click metrics: Within the Replug analytics dashboard, focus on metrics related to unique clicks. Replug automatically filters out duplicate clicks and provides accurate counts of unique interactions with your tracked links.
7.Monitor and optimize: Regularly monitor Replug’s analytics dashboard to track unique clicks over time. Use this data to optimize your campaigns, refine your content strategies, and maximize engagement.
Why are unique clicks important?
Unique clicks are important in digital marketing for several reasons:
Accurate engagement measurement:
Unique clicks provide a more accurate measure of user engagement compared to total clicks. By counting each user only once, unique clicks eliminate the skewing effect of multiple clicks from the same individual, giving a clearer picture of actual engagement levels.
Quality of audience engagement:
Unique clicks indicate the number of distinct individuals who have interacted with a piece of content or a campaign. This metric helps assess the quality of audience engagement and the effectiveness of marketing efforts in reaching and resonating with the target audience.
ROI evaluation:
Understanding unique clicks allows marketers to assess the return on investment (ROI) of their campaigns more effectively. By measuring the number of unique individuals who have engaged with the content relative to the total audience reached, marketers can gauge the efficiency and effectiveness of their marketing spend.
Optimization of campaigns:
Tracking unique clicks enables marketers to identify which campaigns, channels, or content types are driving the most meaningful engagement. This data empowers marketers to optimize their campaigns by reallocating resources, refining targeting strategies, or adjusting content to better resonate with the audience.
Personalization opportunities:
By analyzing unique clicks, marketers can gain insights into individual user preferences and behaviors. This information can be used to personalize future marketing efforts, delivering content and offers tailored to the specific interests and needs of different segments of the audience.
A complete link management solution
for marketing professionals & agencies.
Try Replug for free
FAQs
How are unique clicks different from total clicks?
Unique clicks count each individual user only once, regardless of how many times they click on the link. Total clicks, on the other hand, tally every instance of a click, including multiple clicks from the same user. Unique clicks offer a more refined measure of user engagement, focusing on the number of unique individuals interacting with the content.
How can I track unique clicks for my campaigns?
You can track unique clicks using digital analytics tools or by leveraging specialized link-tracking platforms like Replug. These tools provide insights into the number of distinct users who have clicked on your links, allowing you to measure unique clicks accurately and optimize your campaigns based on user engagement.
Can bots affect unique click counts?
Yes, bots can potentially inflate unique click counts if they interact with your content. To mitigate this issue, it’s essential to implement bot detection mechanisms and filter out bot-generated clicks from your analytics data. This ensures that your unique click counts accurately reflect genuine user engagement.
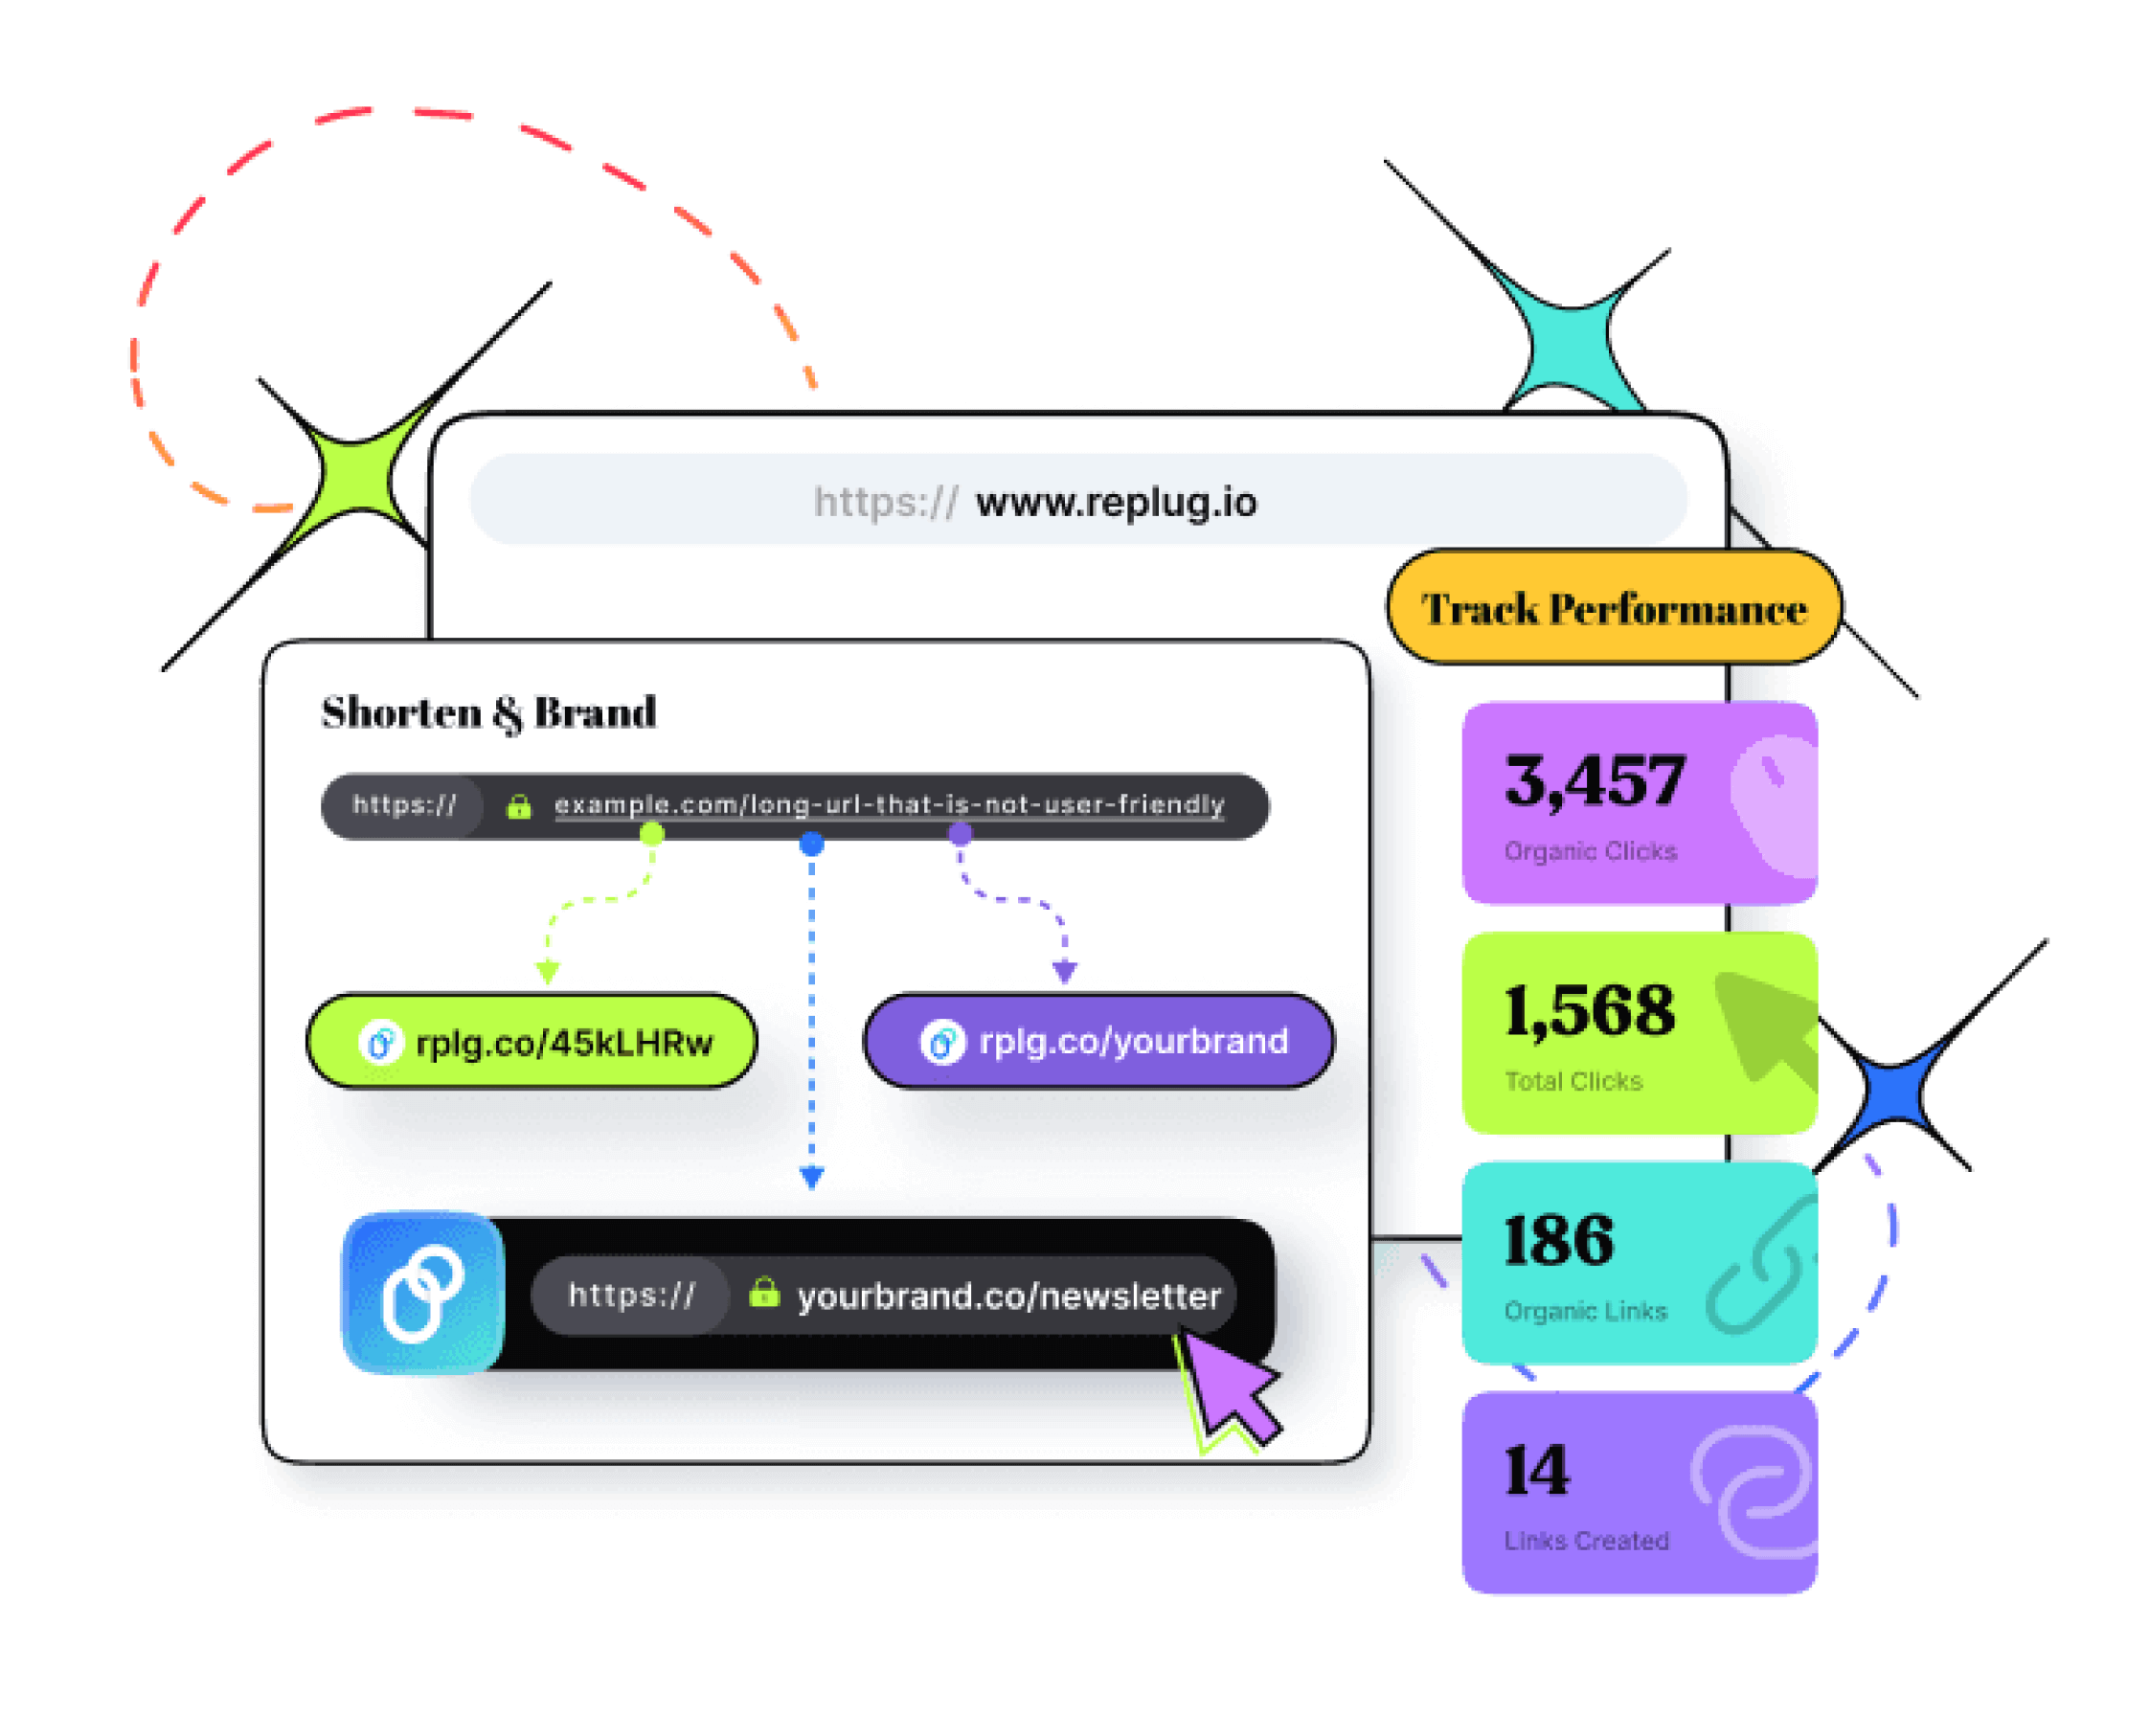
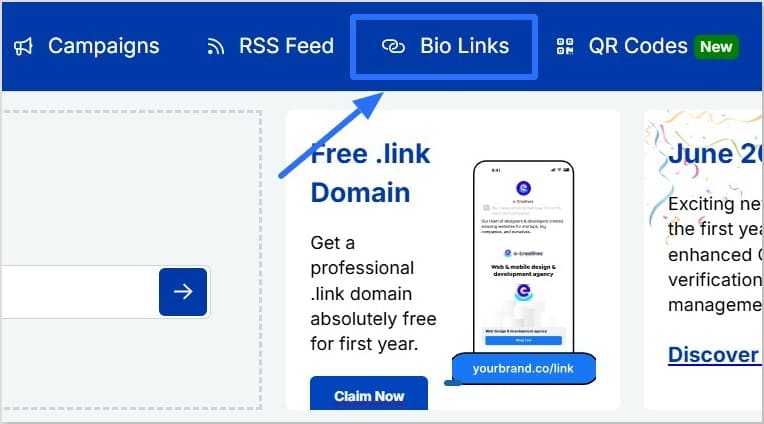
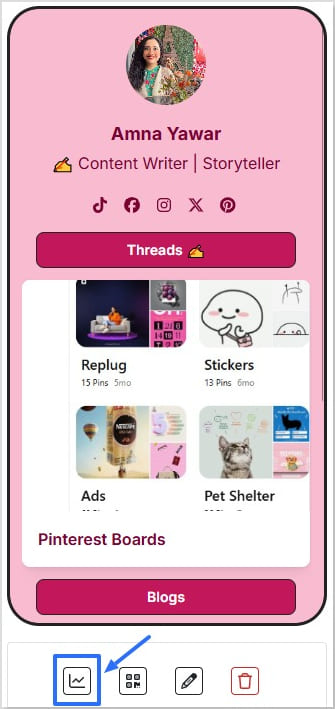

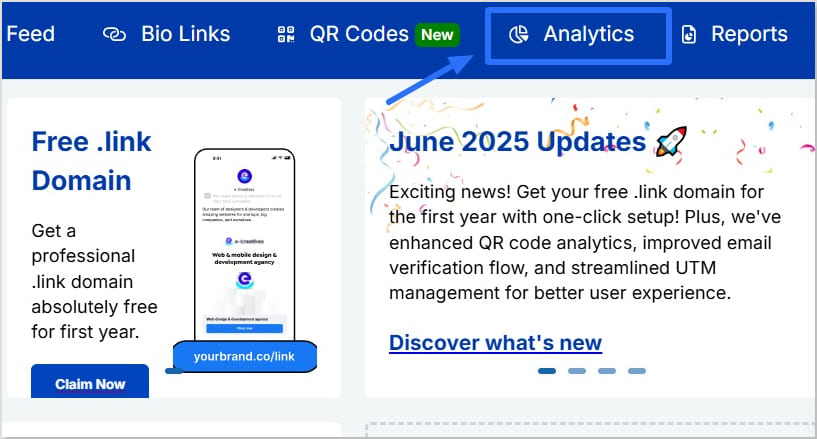
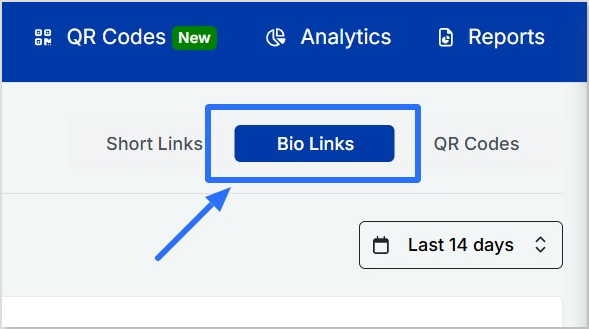
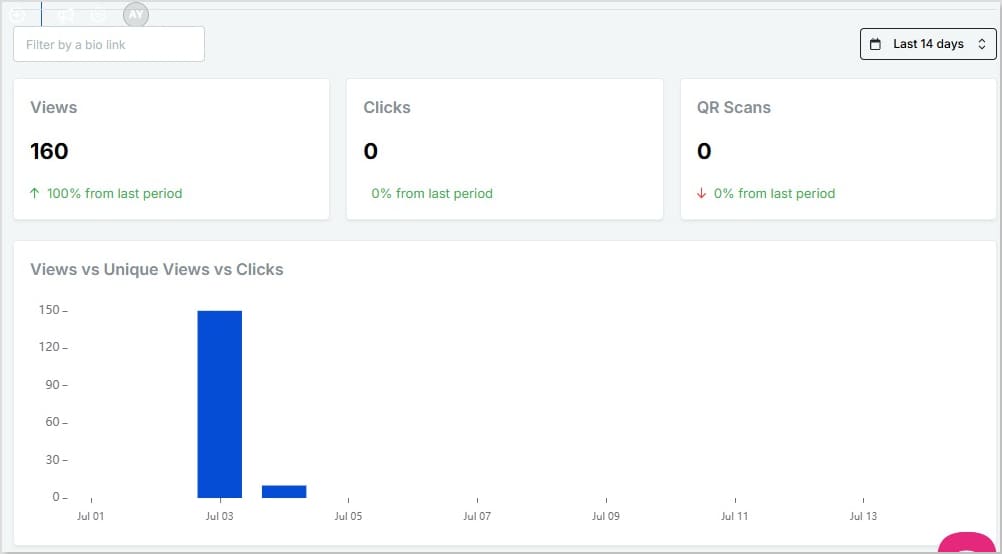

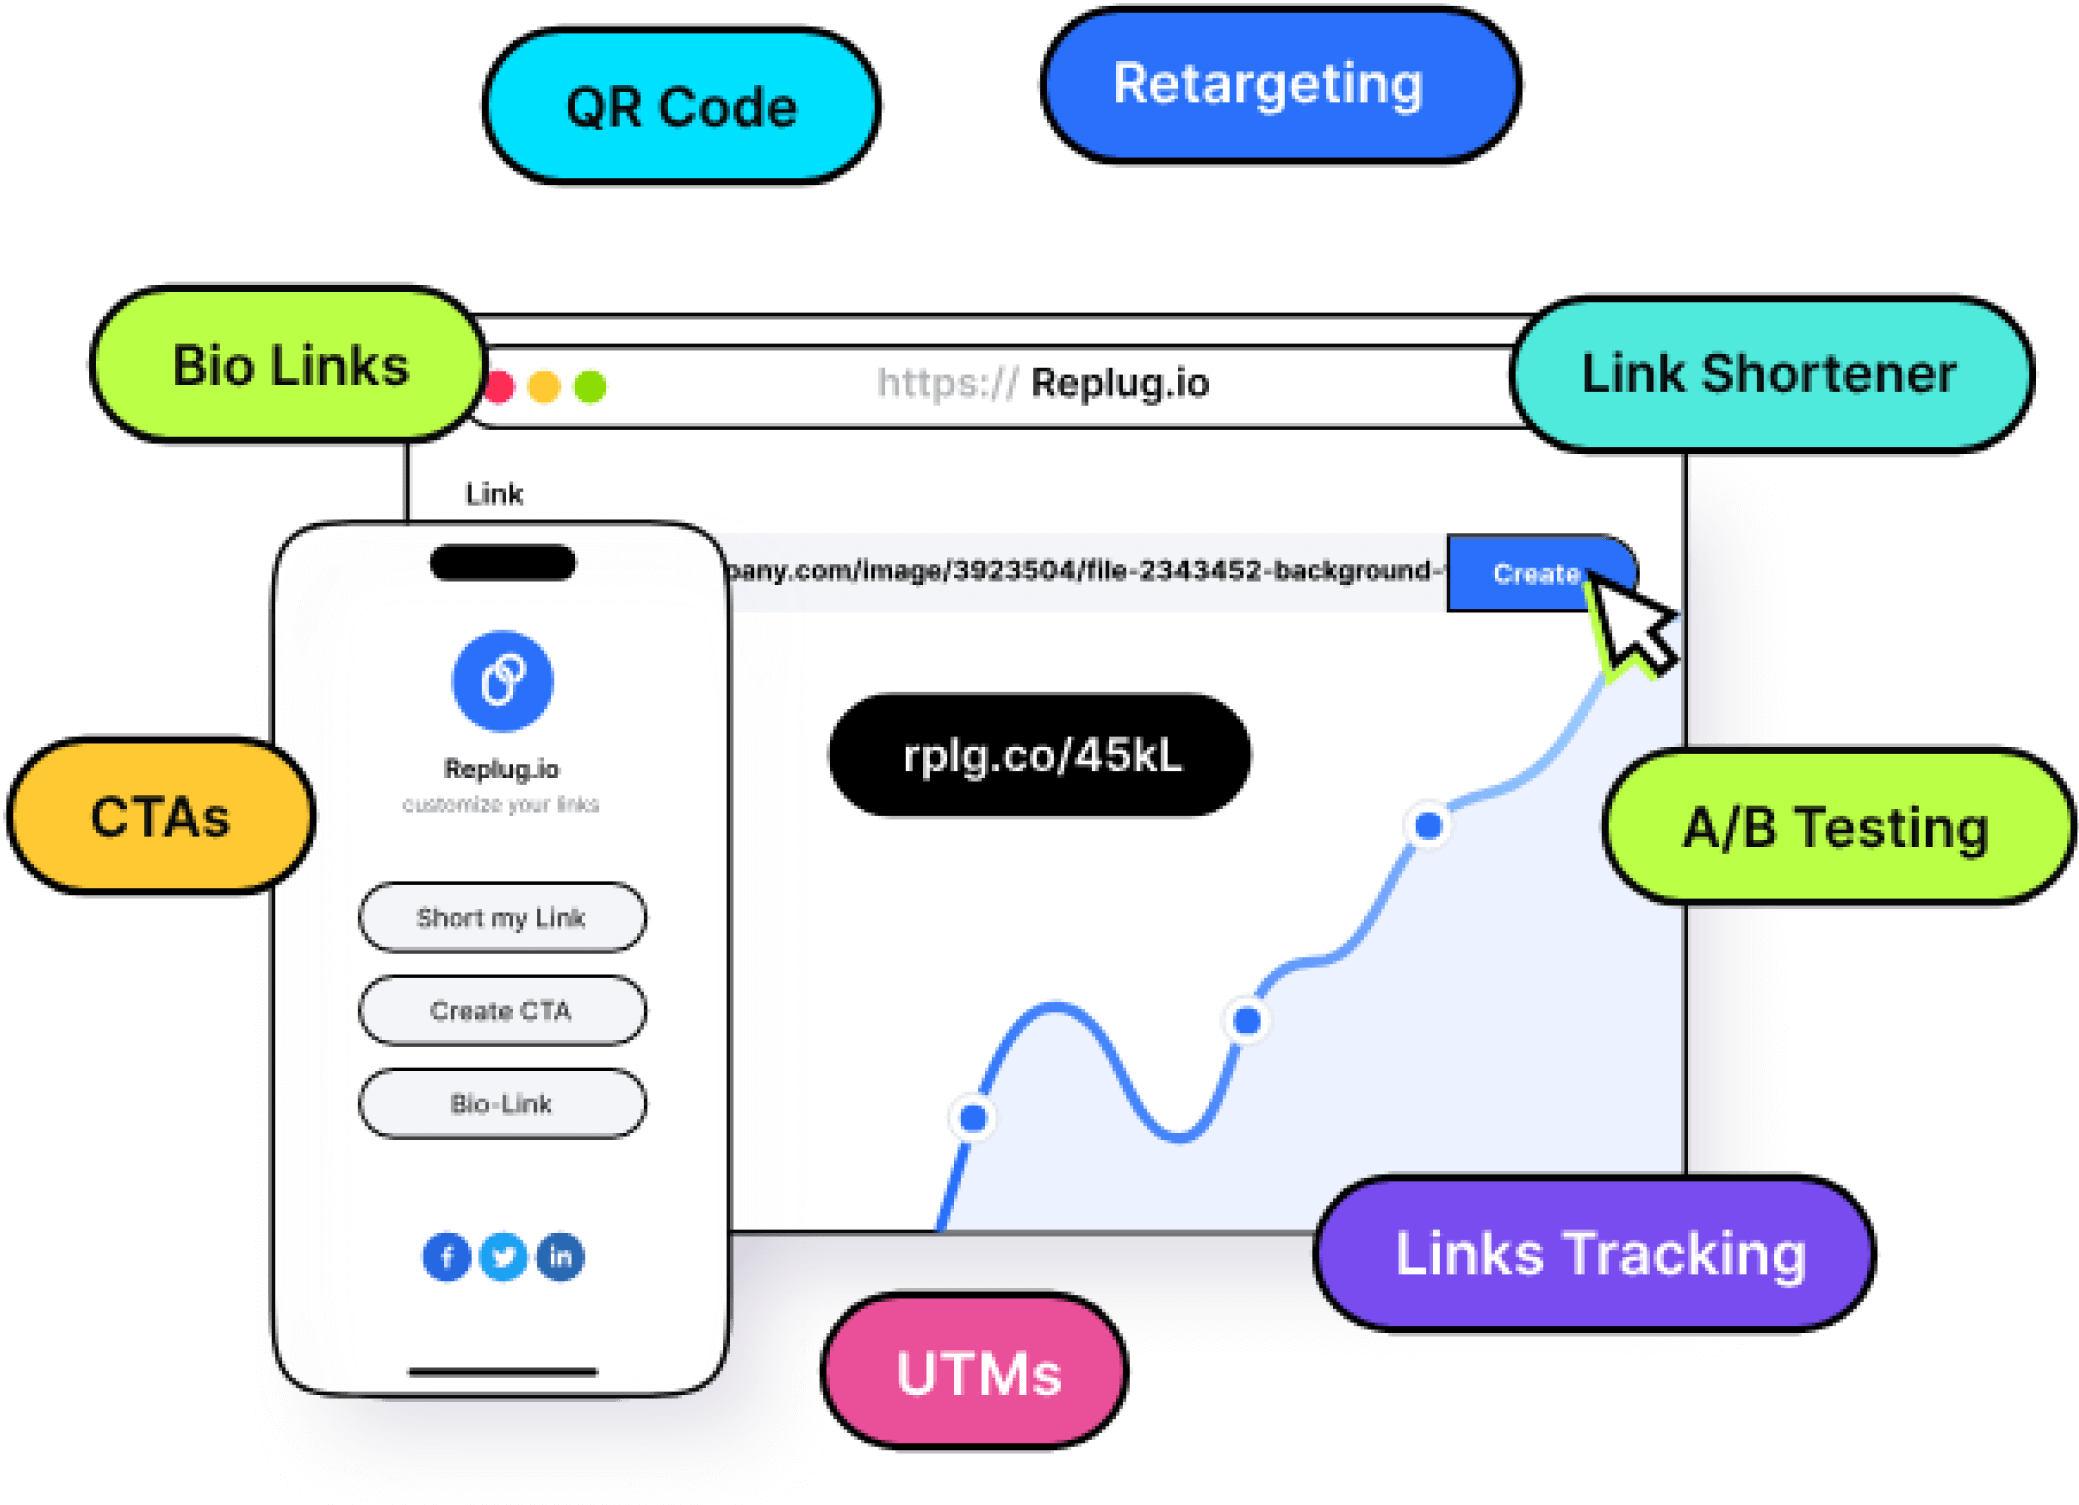
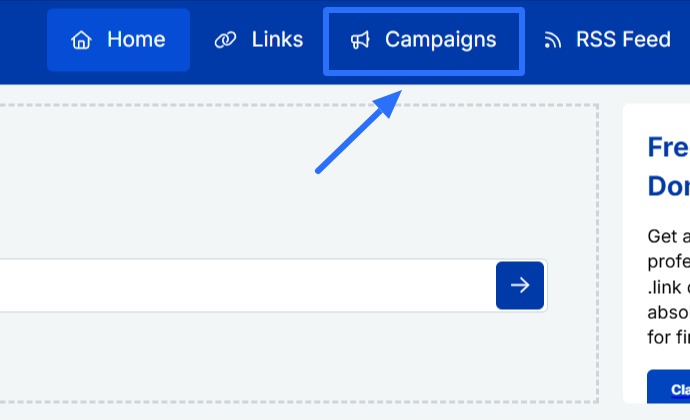
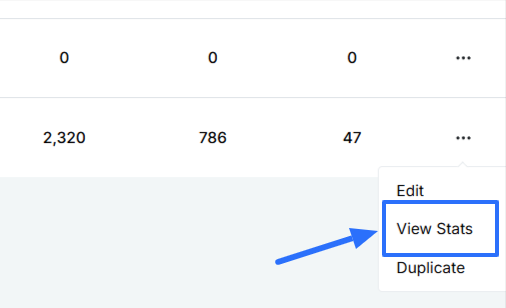
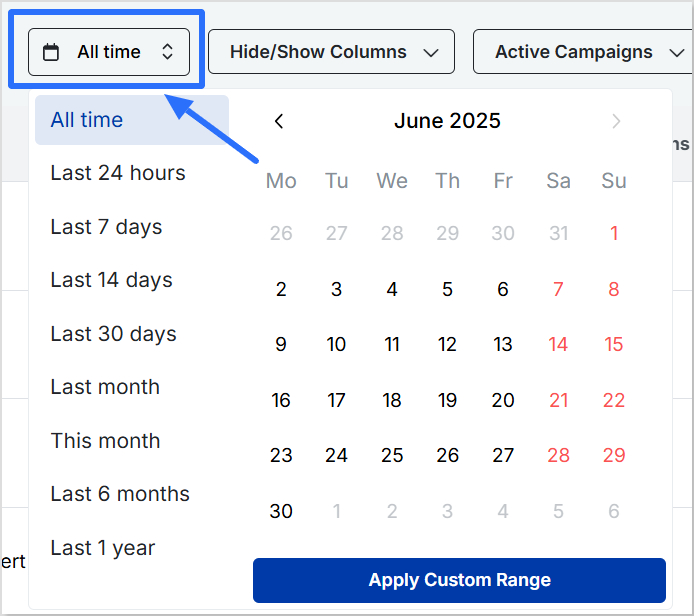
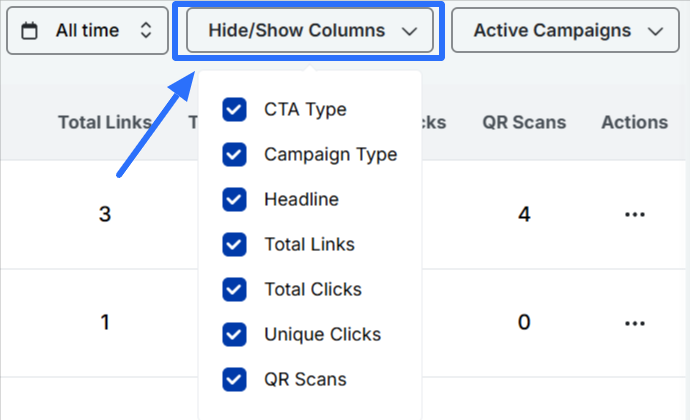
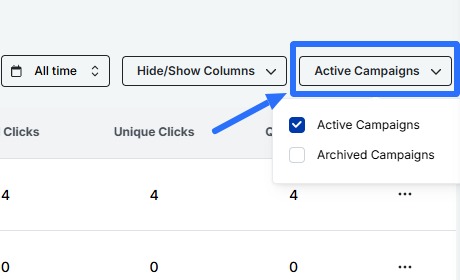
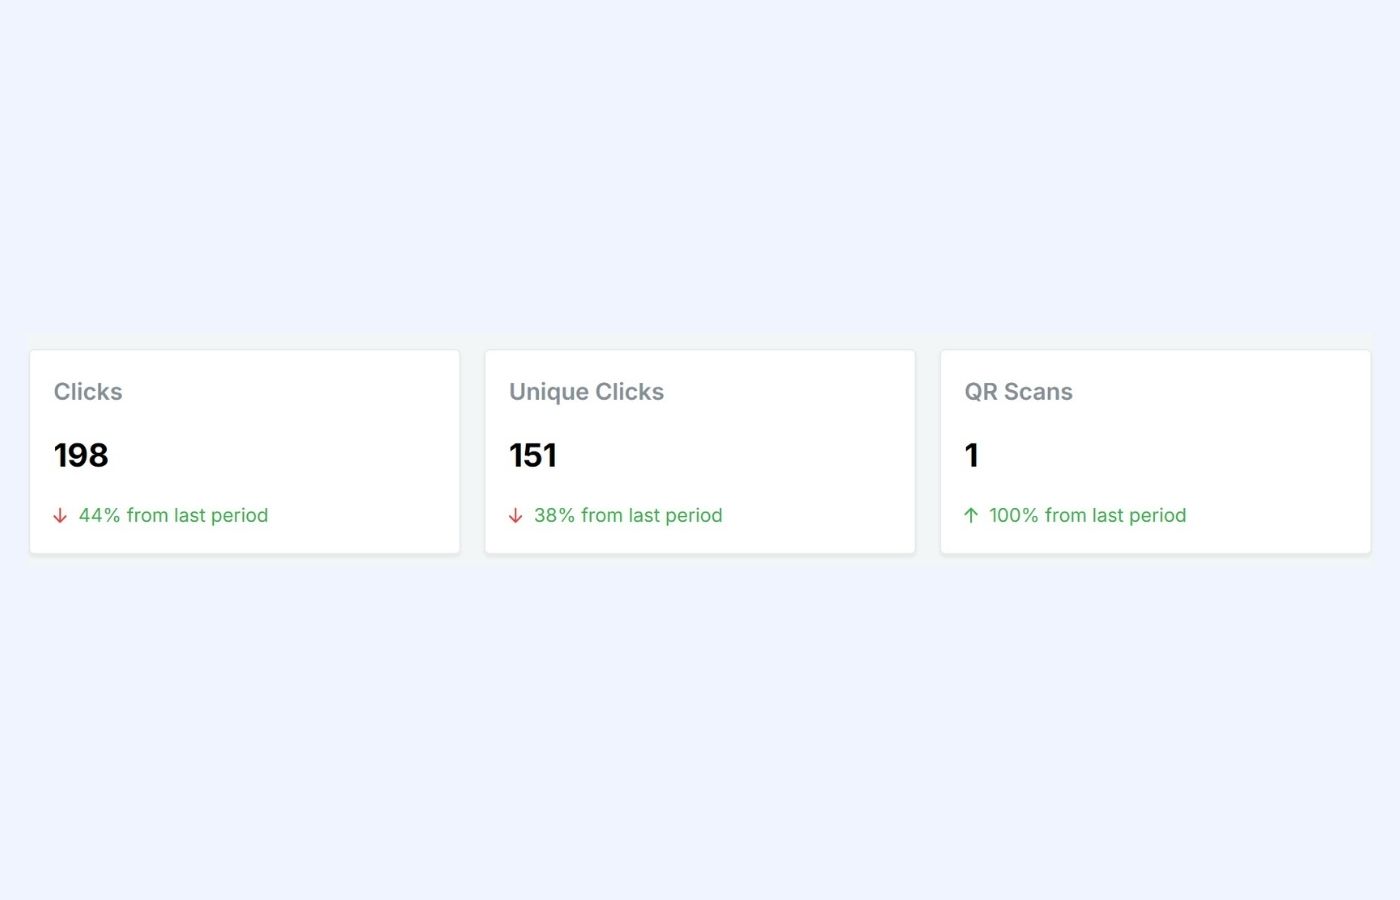
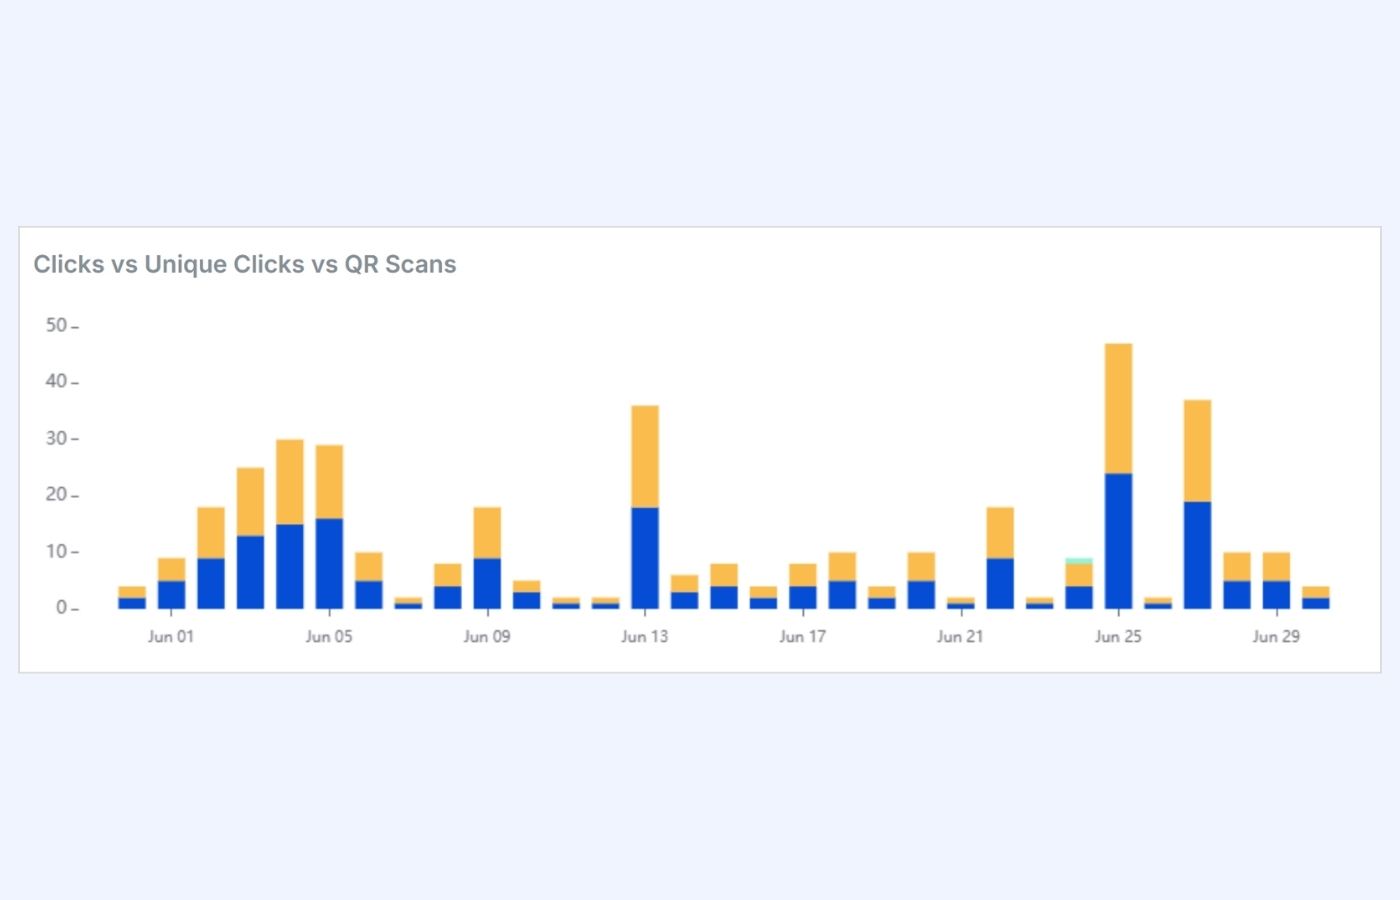
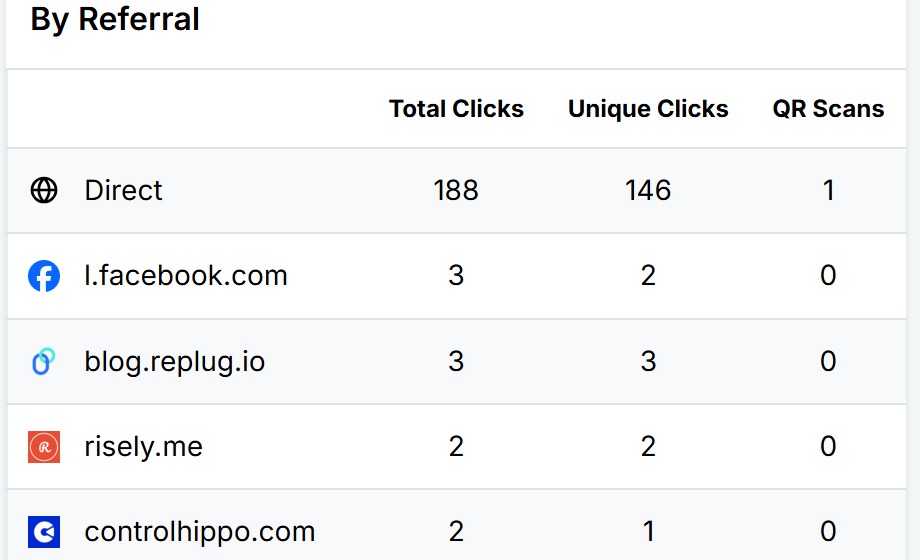
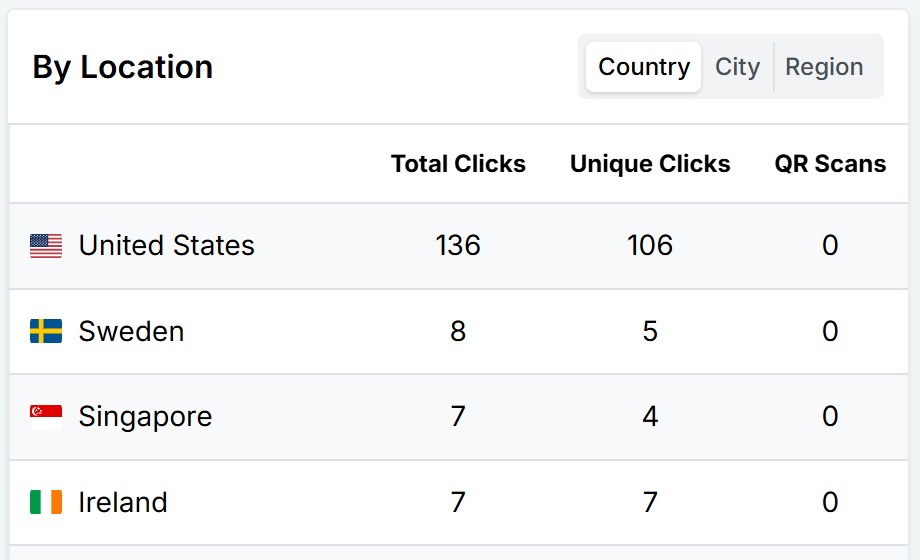
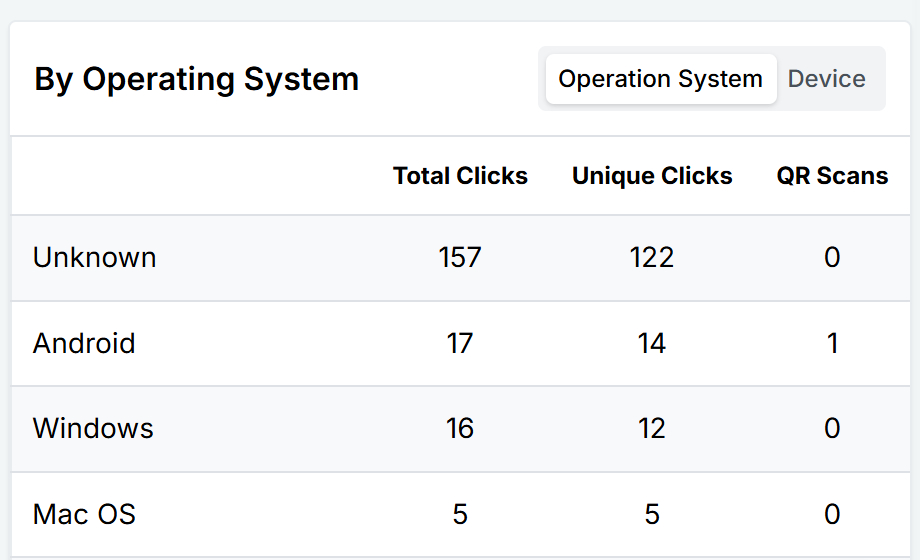
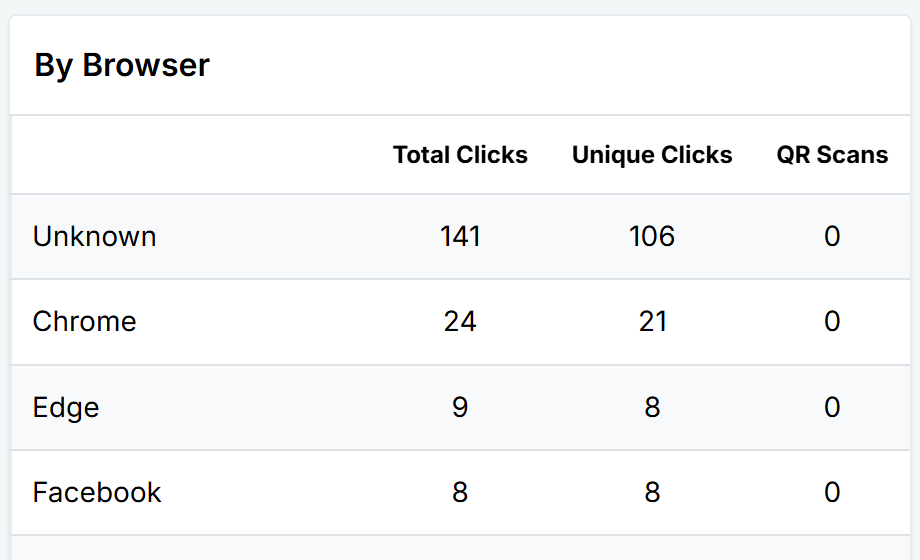

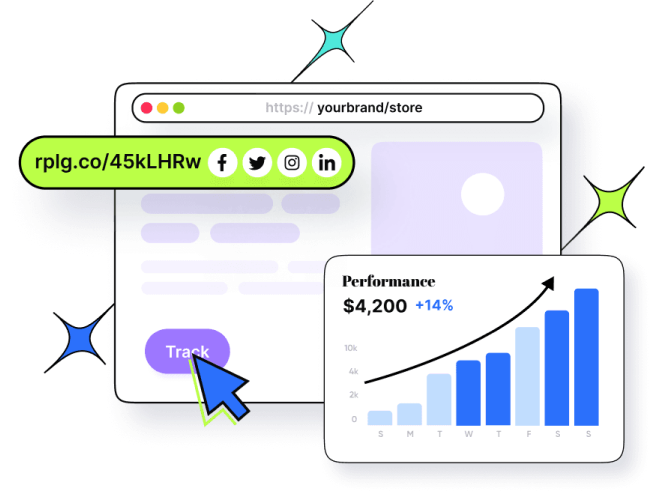
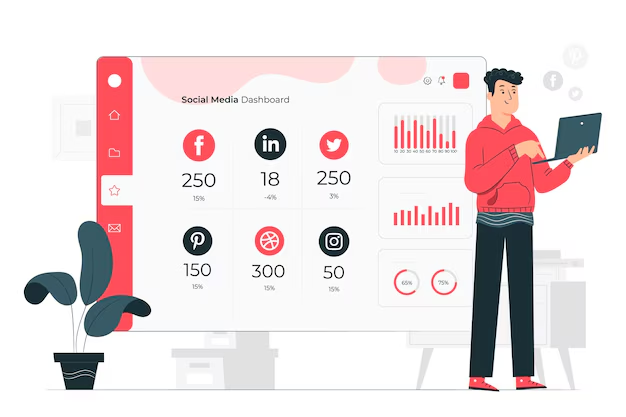

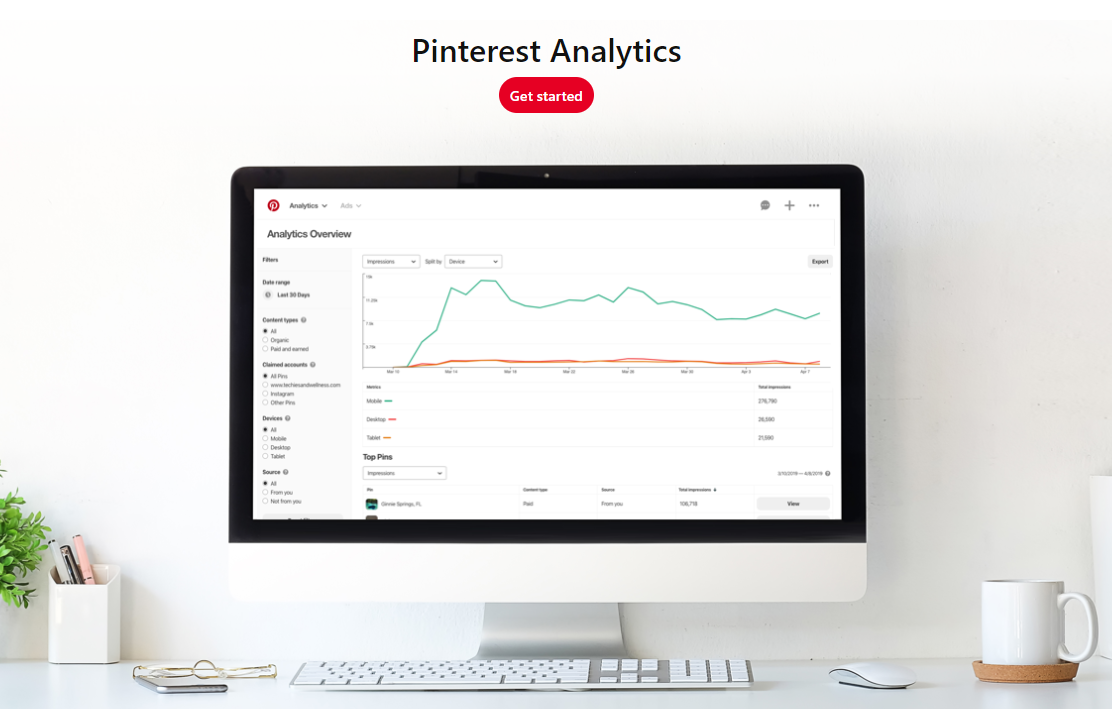
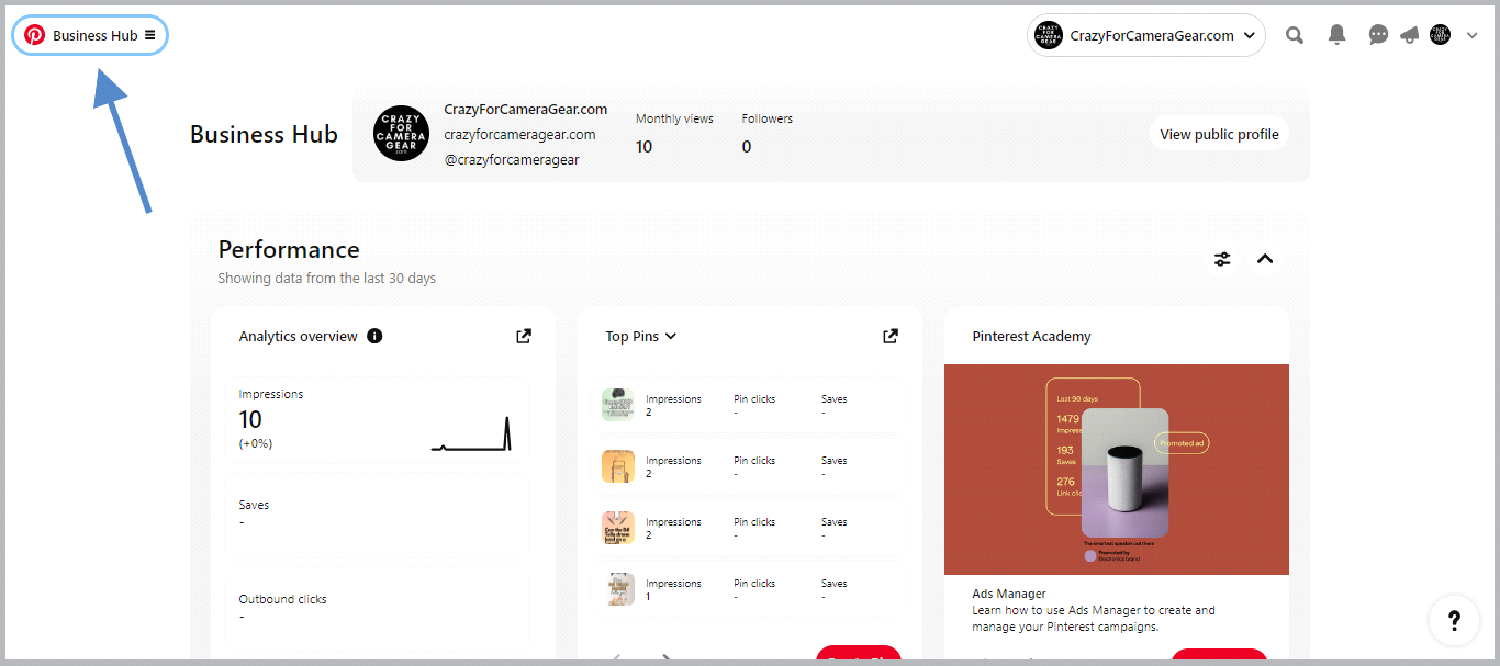
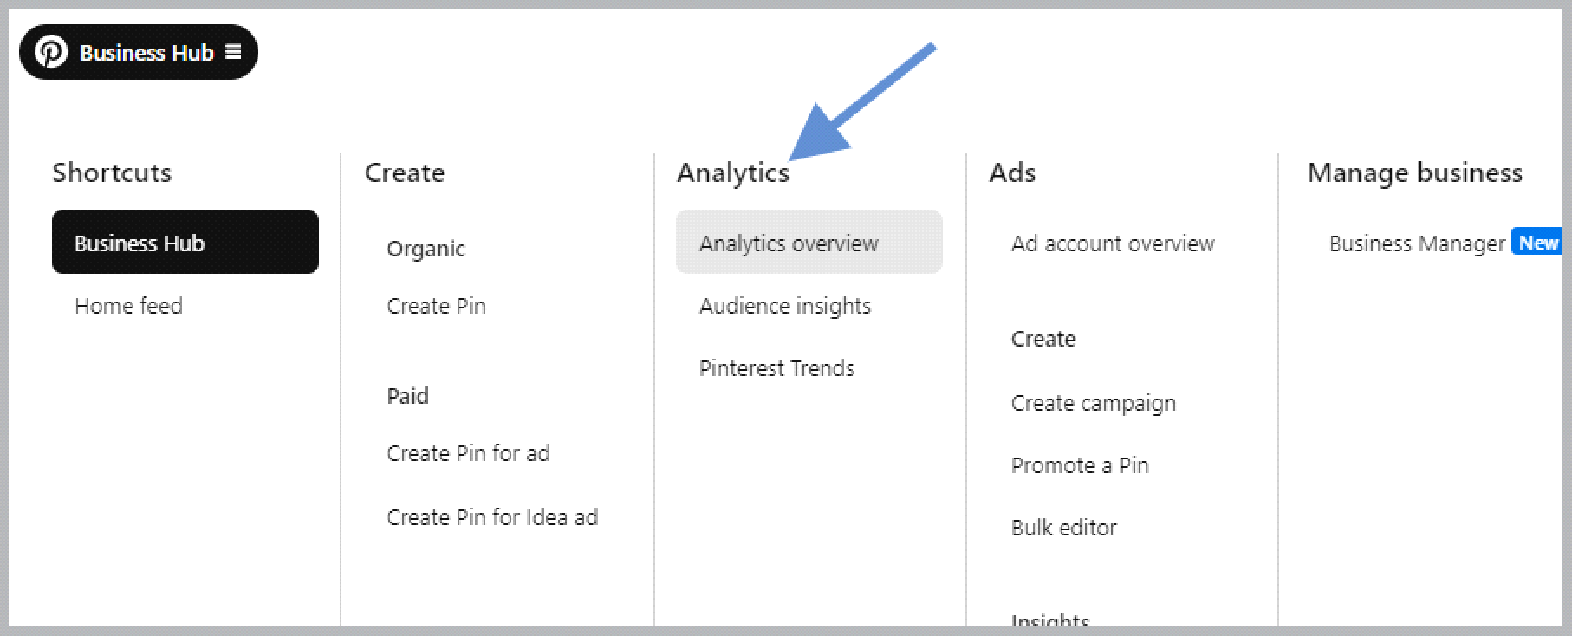
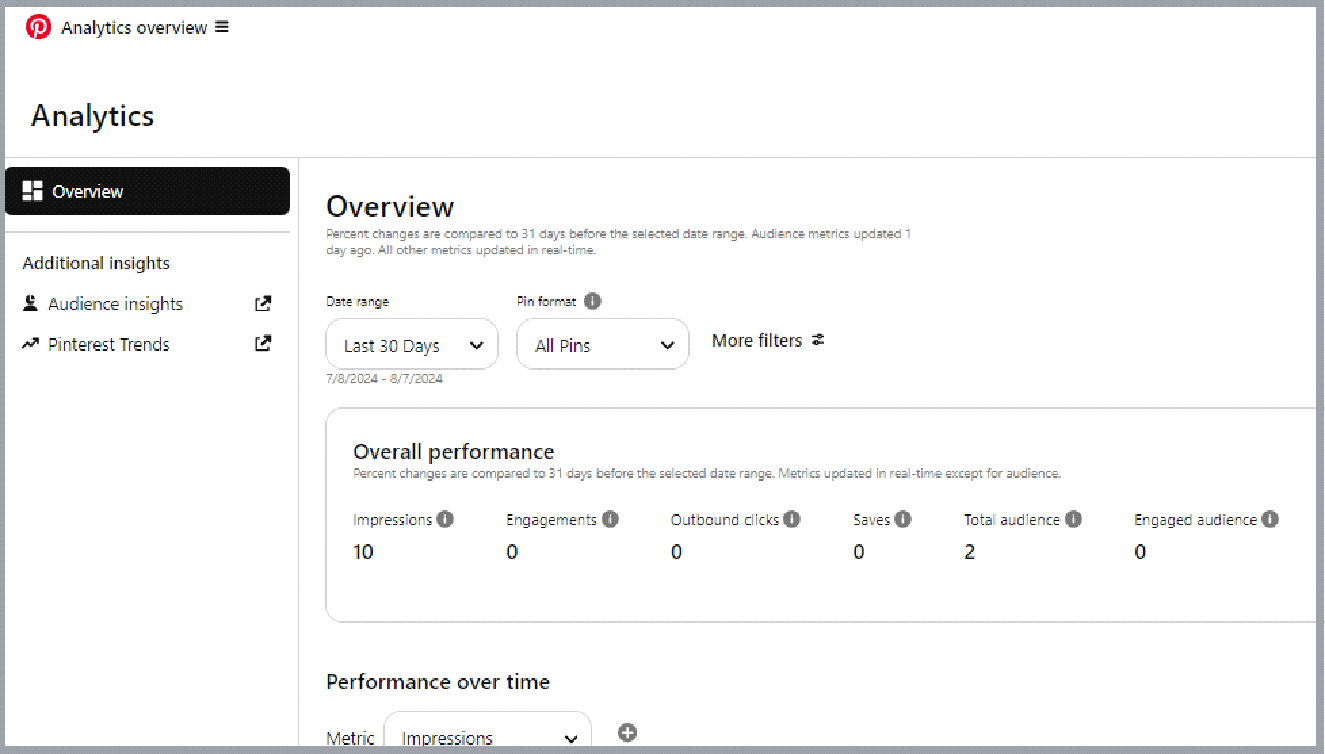


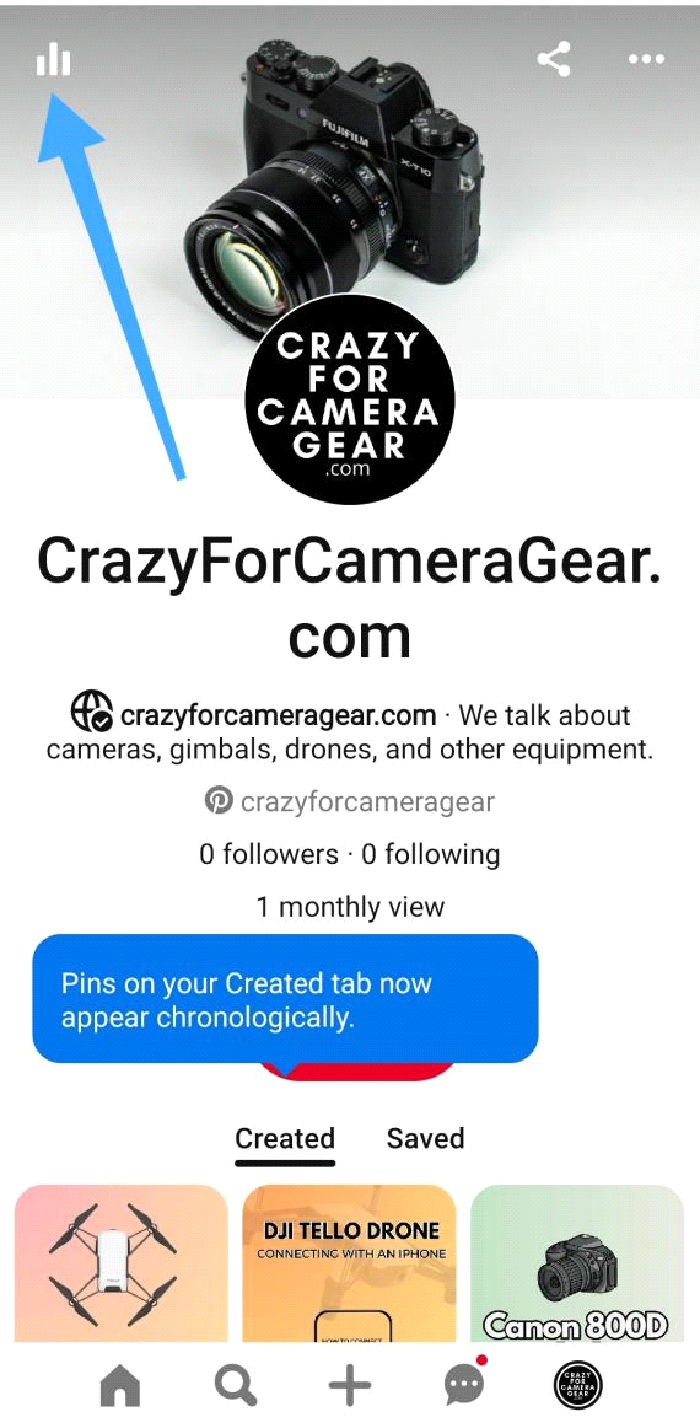
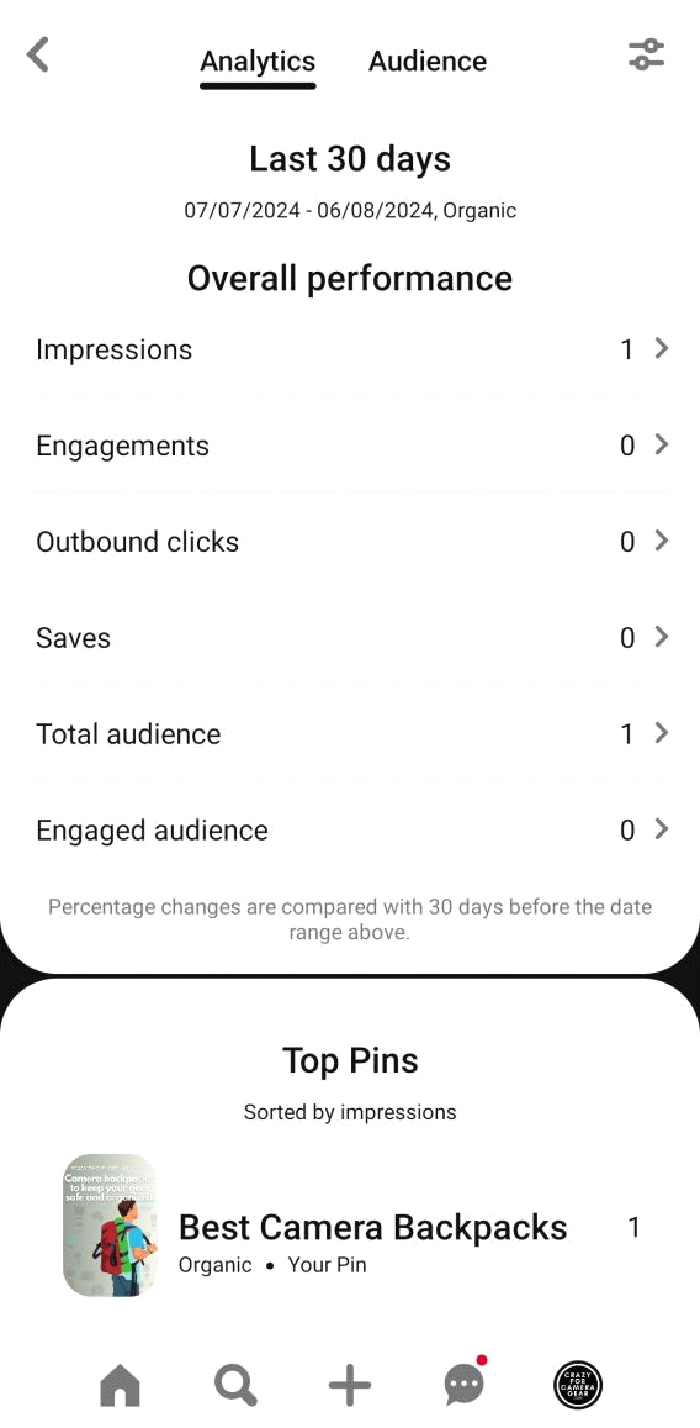


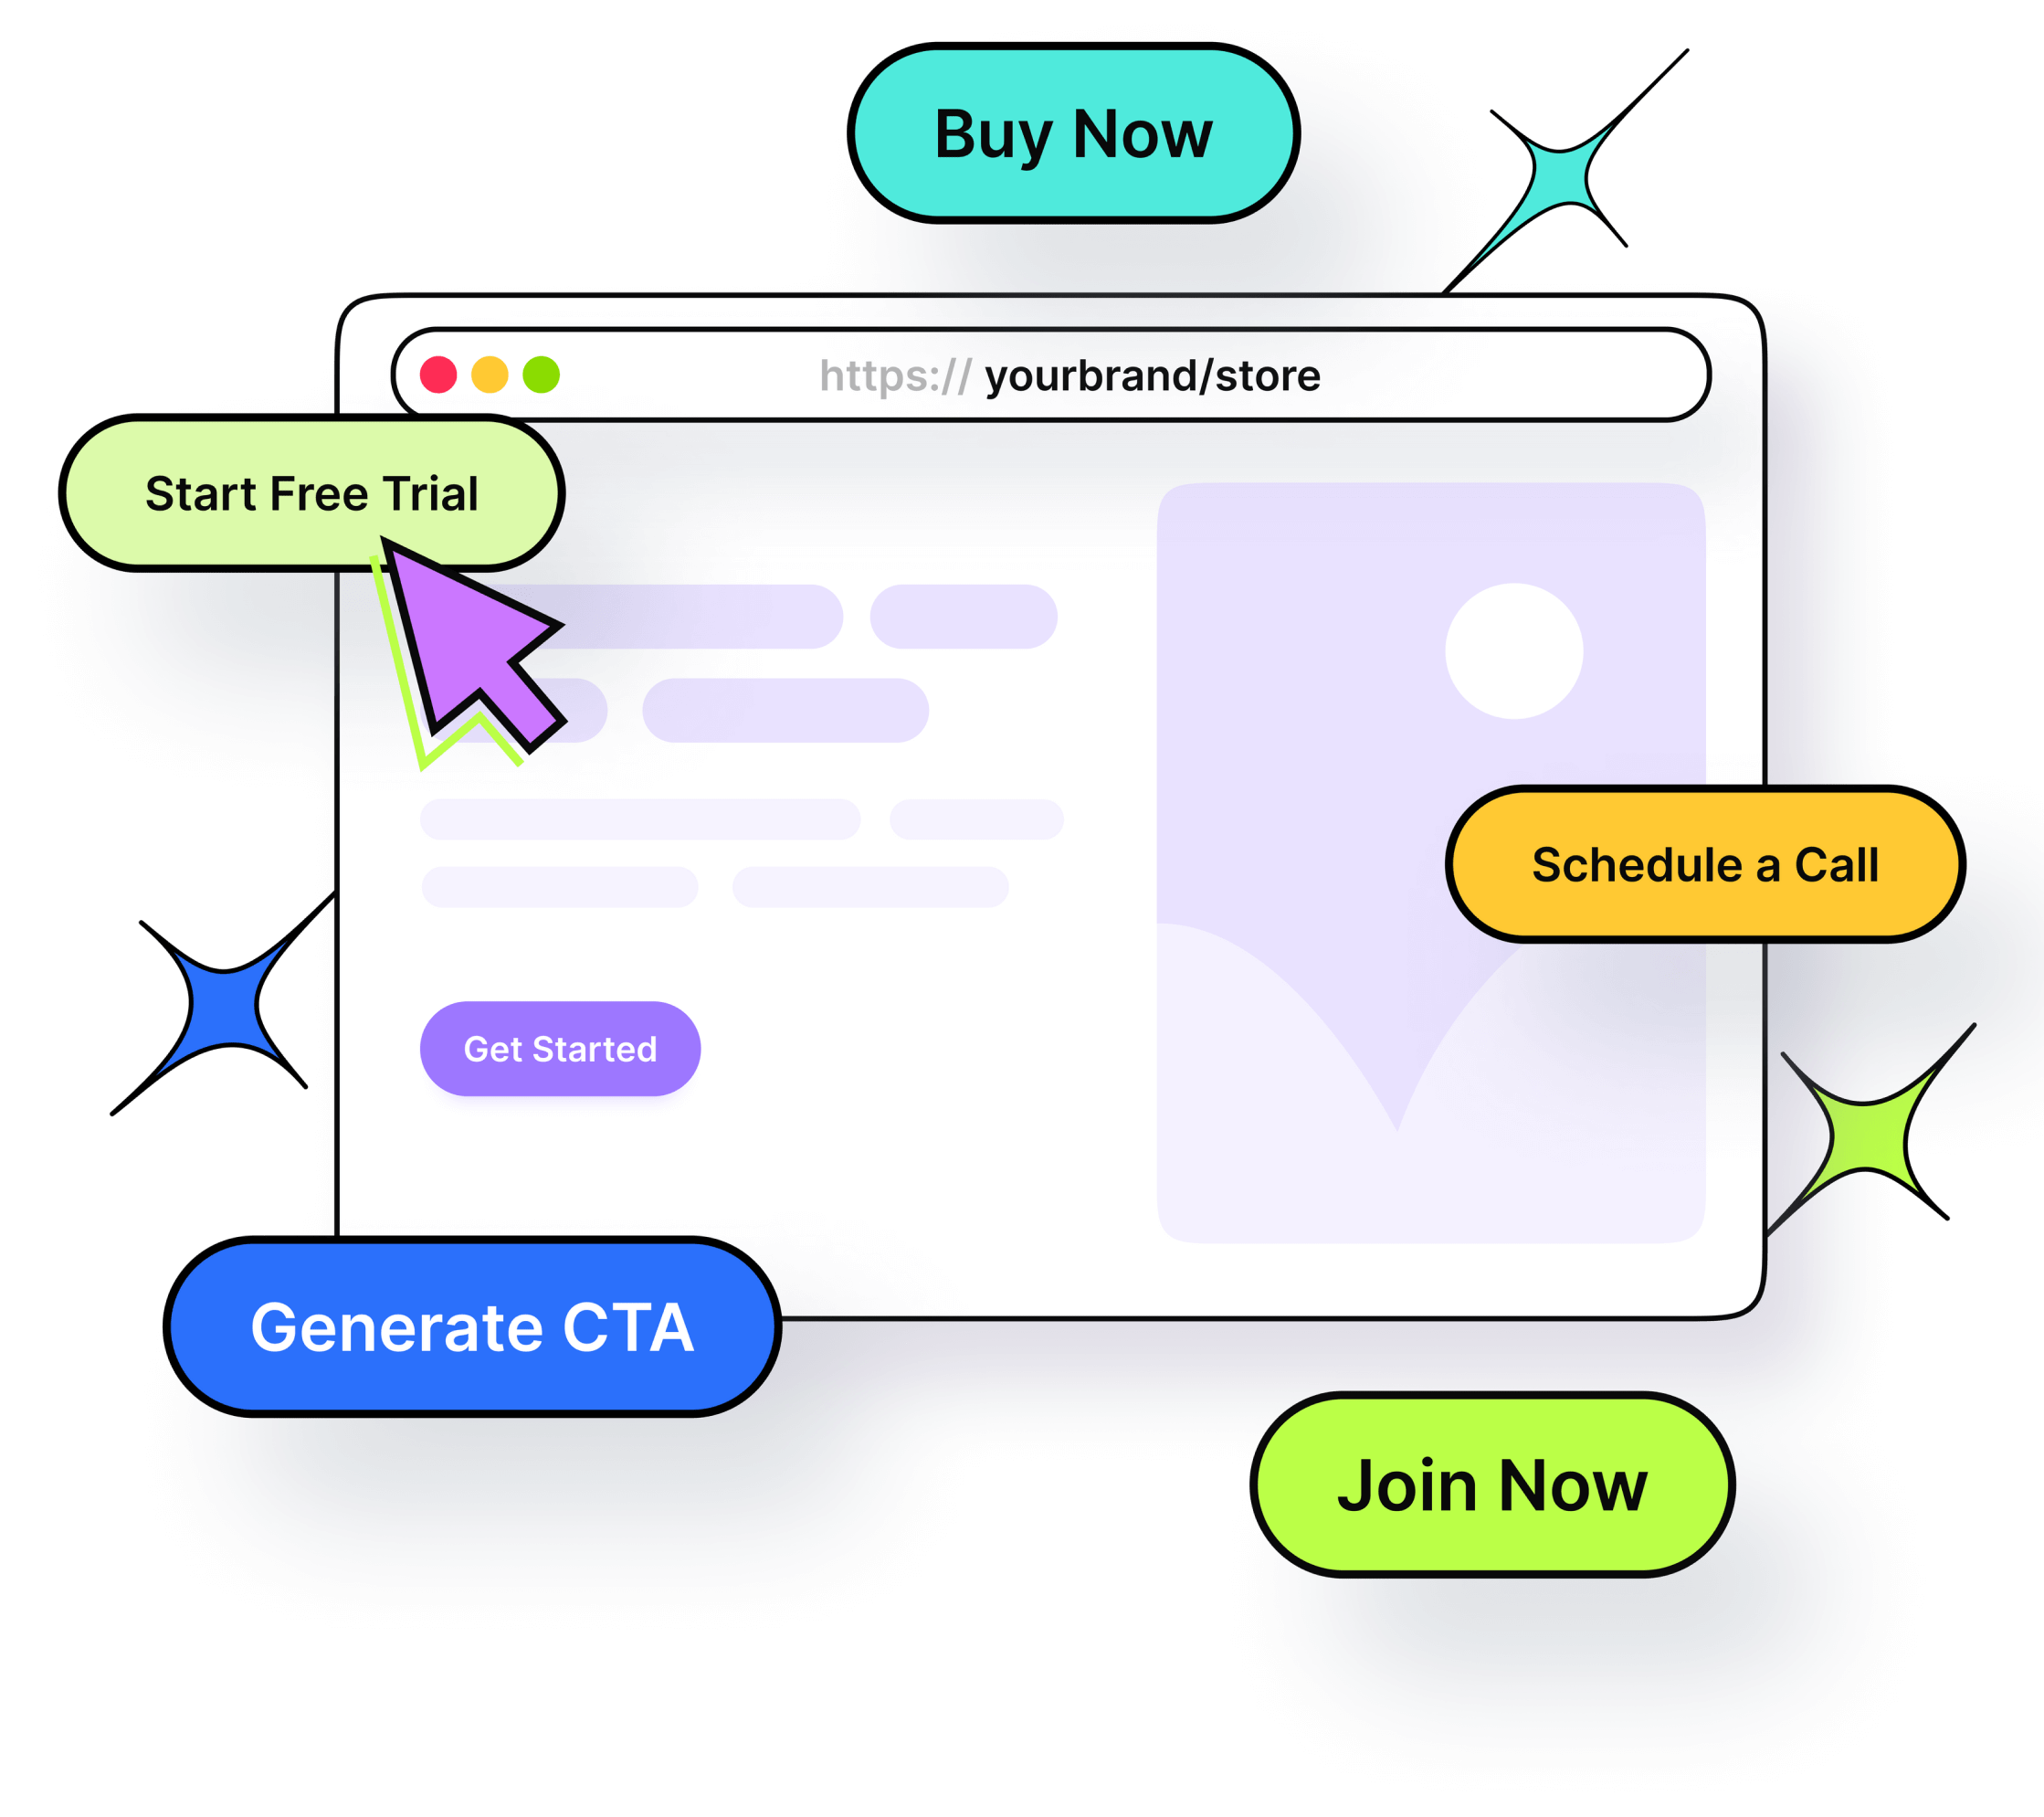


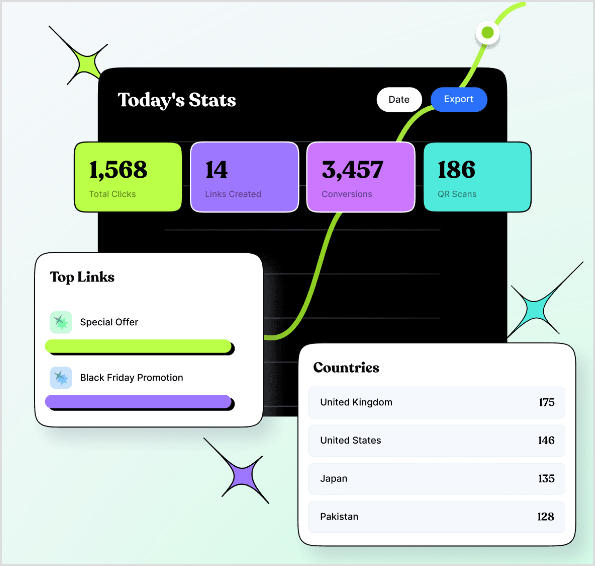
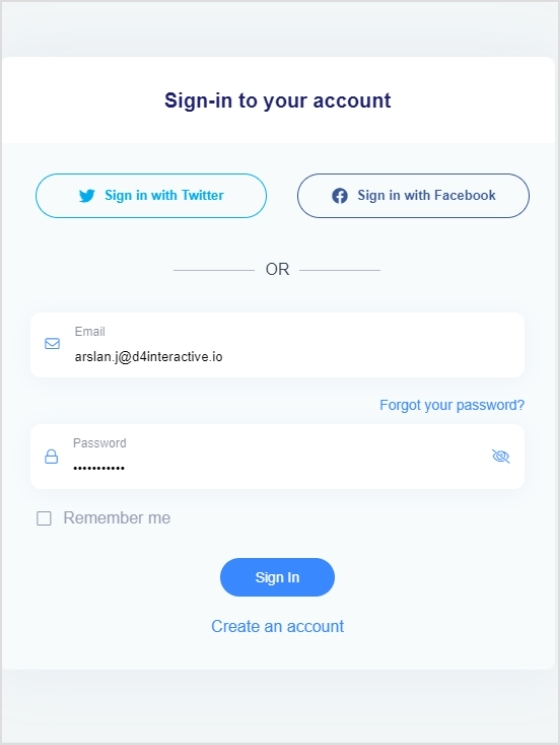
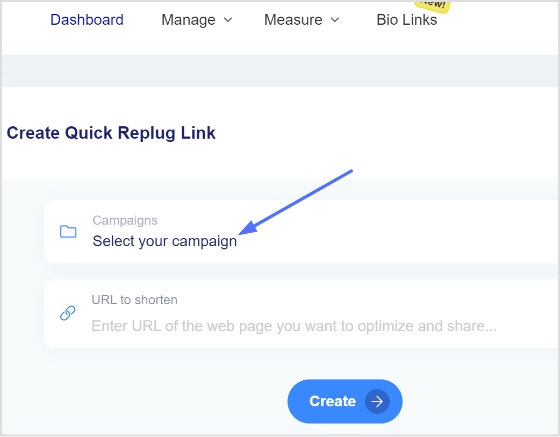
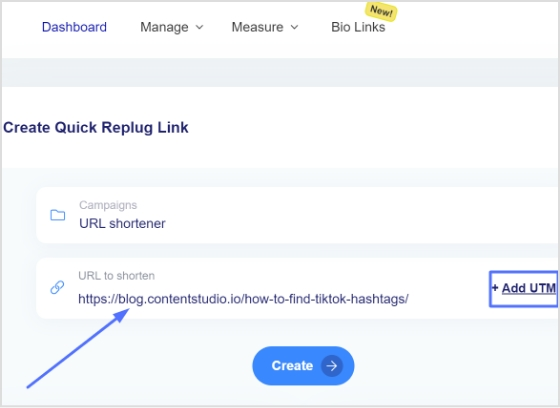
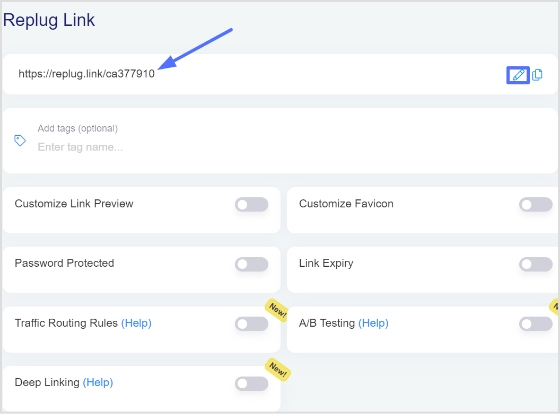
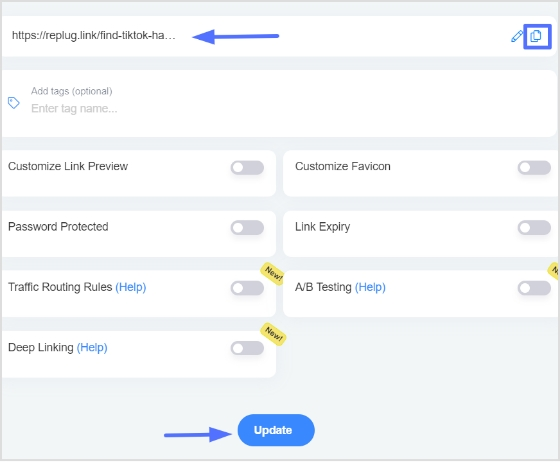
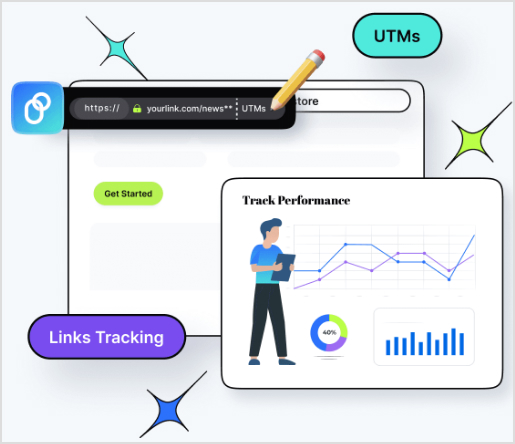

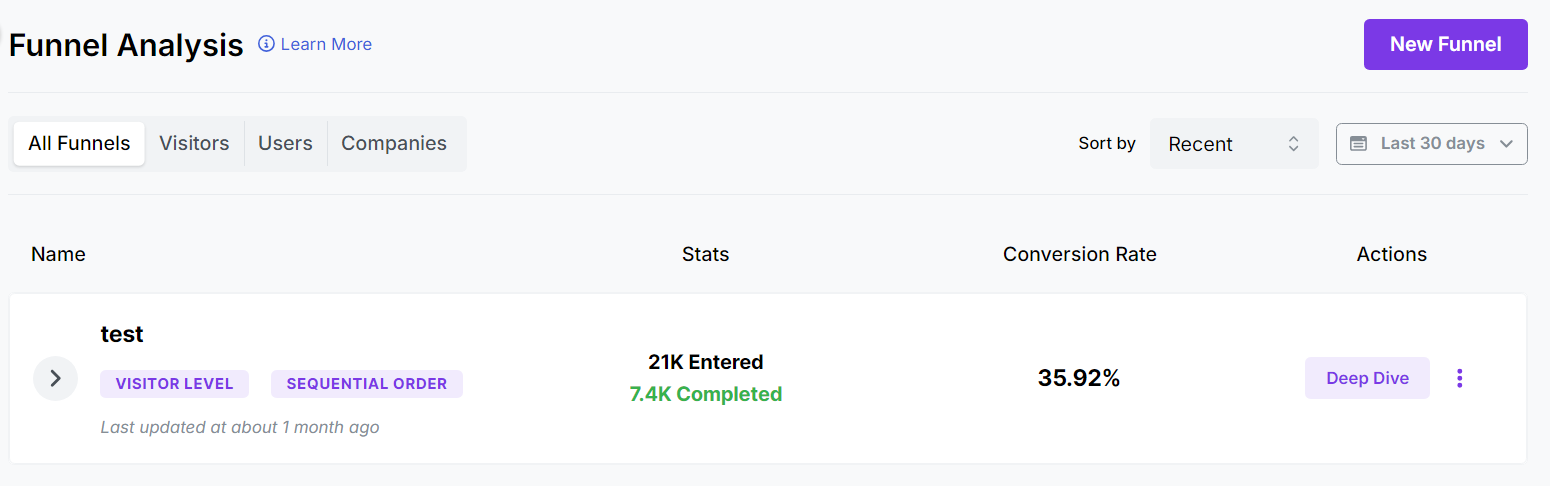
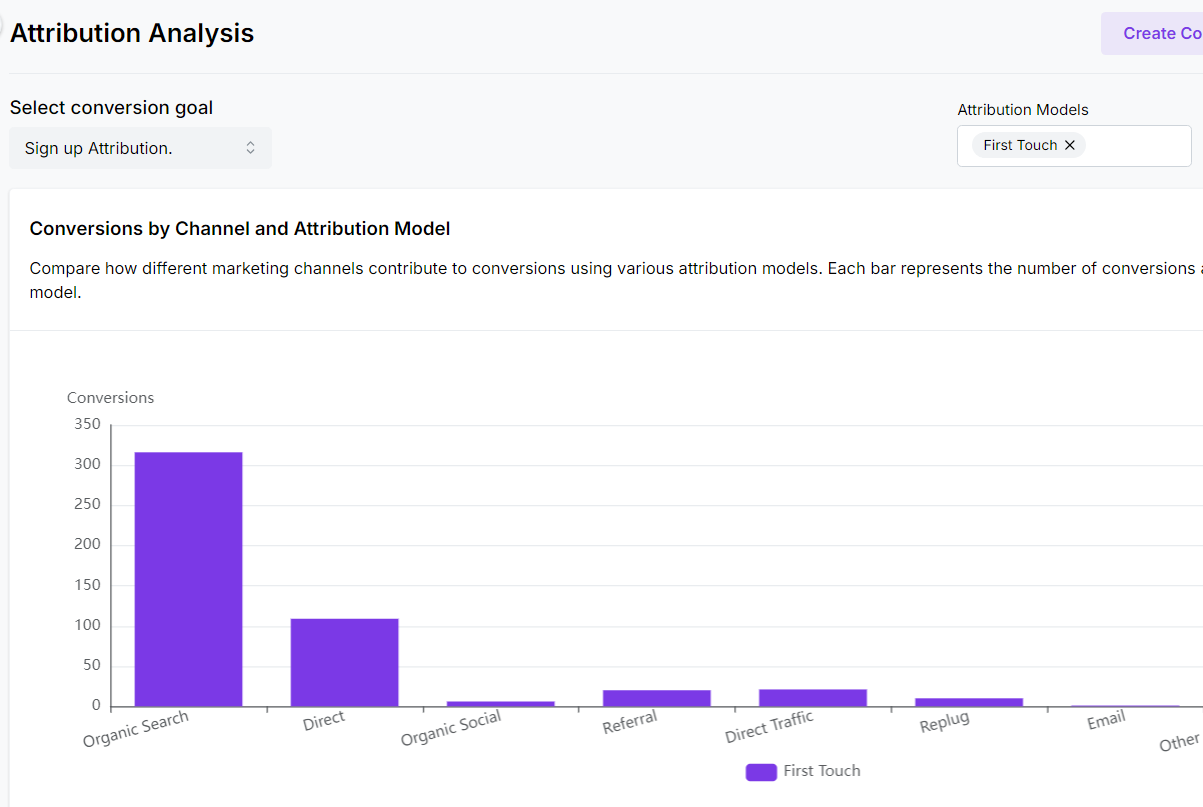
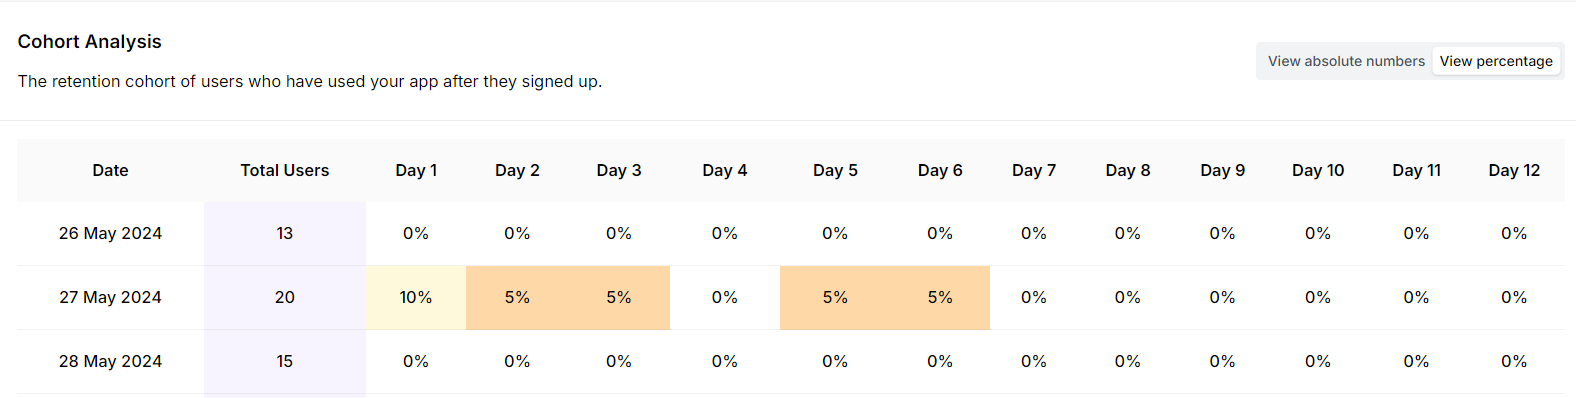
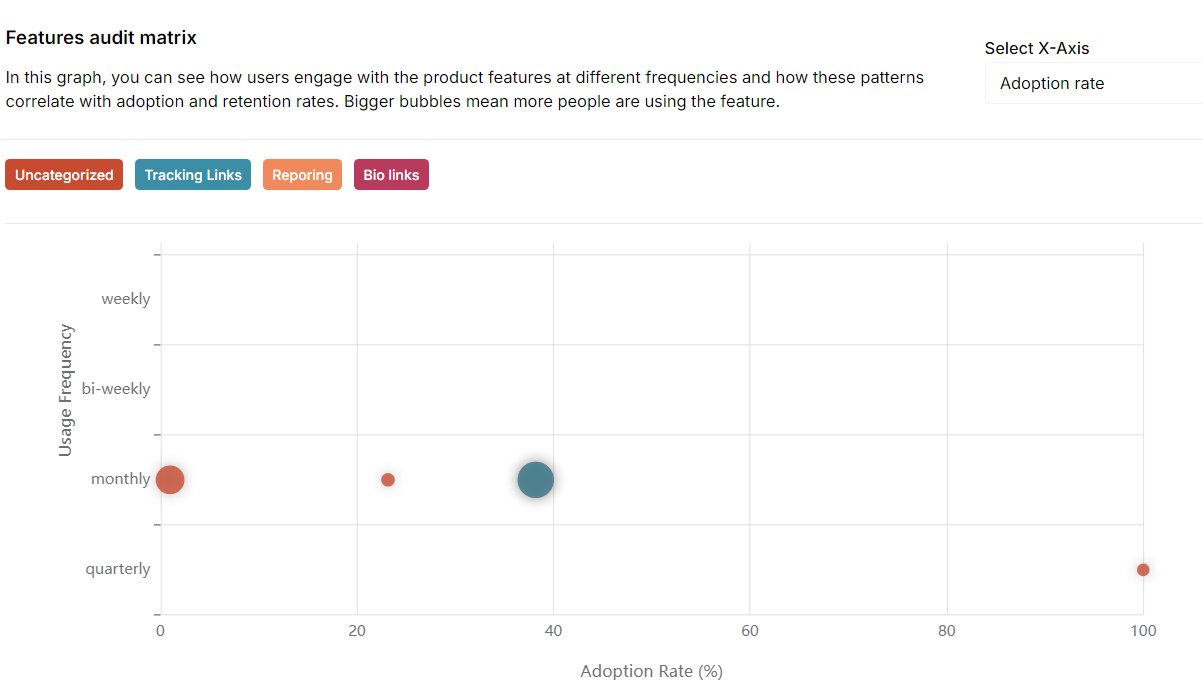
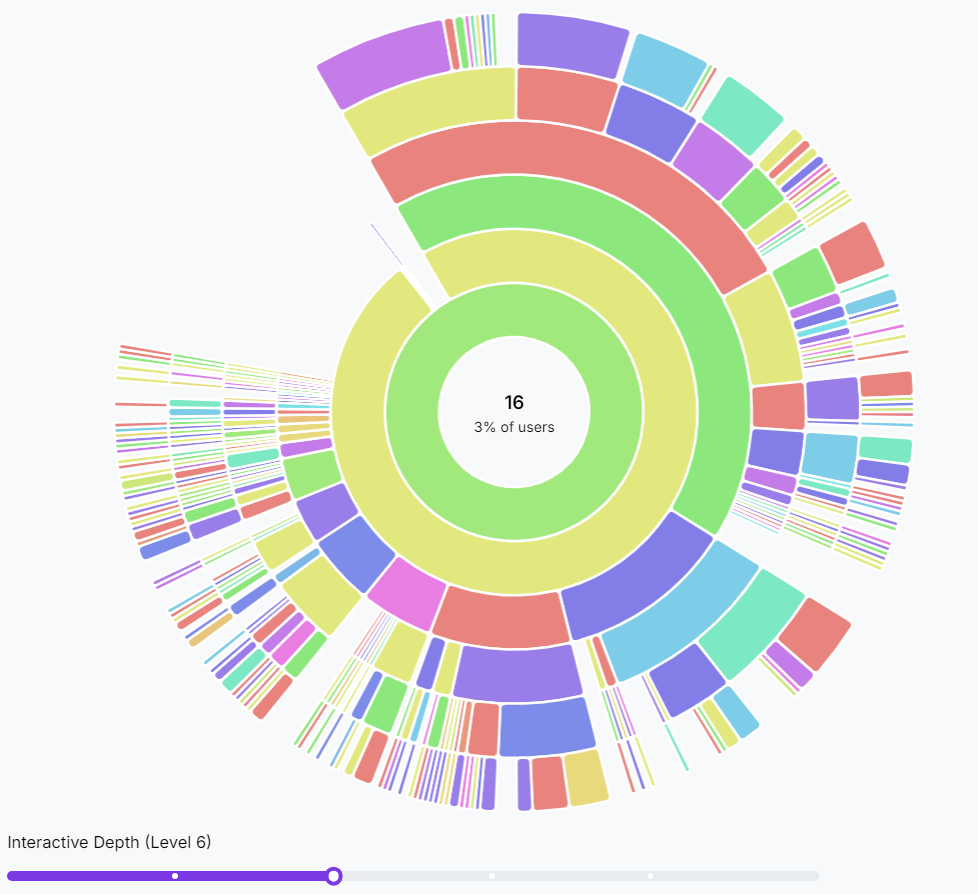
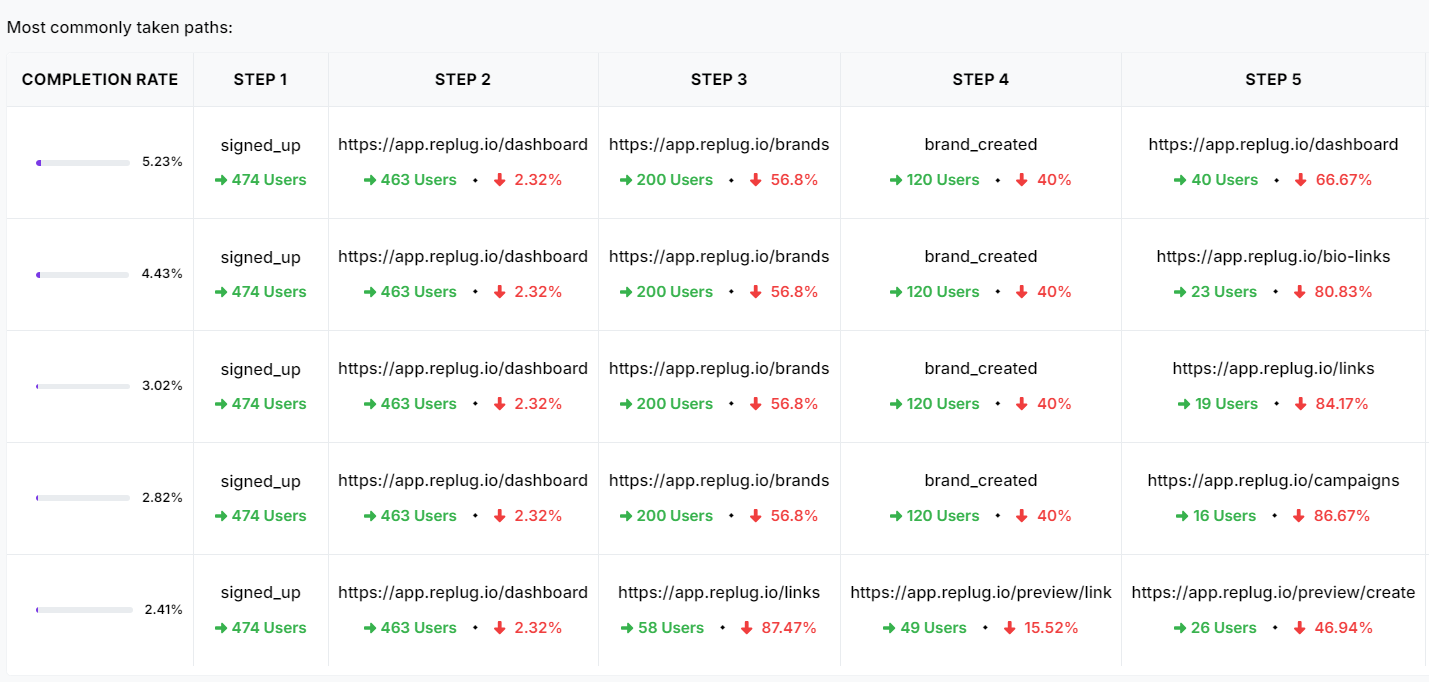 Seeing this journey laid out visually helps you understand how users interact with your product and where you can make changes to create a smoother, more enjoyable experience for them.